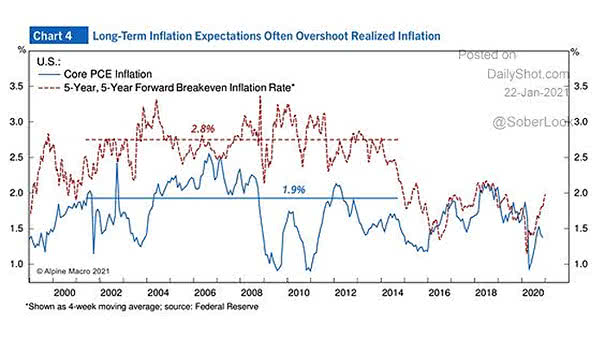
Core PCE Inflation and 5-Year, 5-Year Forward Breakeven Inflation Rate
Core PCE Inflation and 5-Year, 5-Year Forward Breakeven Inflation Rate Are inflation expectations too high? Image: Alpine Macro
Core PCE Inflation and 5-Year, 5-Year Forward Breakeven Inflation Rate Are inflation expectations too high? Image: Alpine Macro
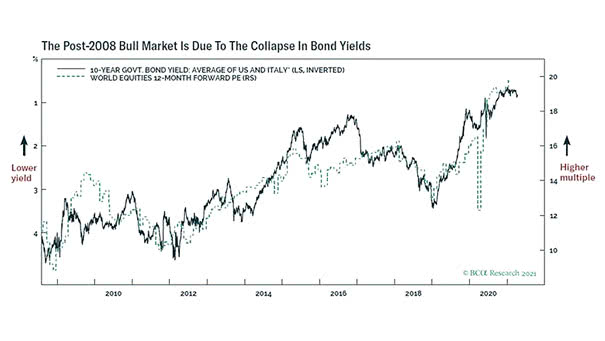
Valuation – 10-Year Government Bond Yield (U.S. and Italy, Advanced by 3-Months) and World Equities 12-Month Forward PE (Leading Indicator) The low levels of government bond yields help to explain the world’s stock market valuation.…
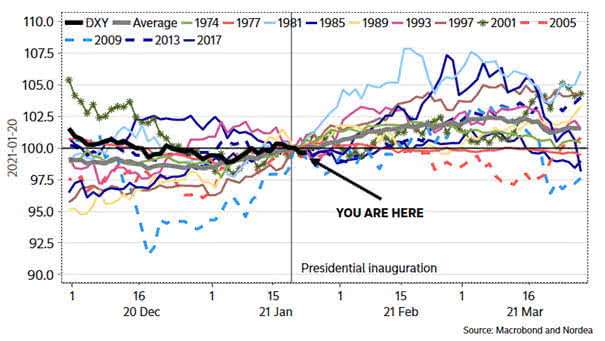
U.S. Dollar and Presidential Inaugurations After U.S. presidential inaugurations, the U.S. dollar tends to rise on average. Image: Nordea and Macrobond
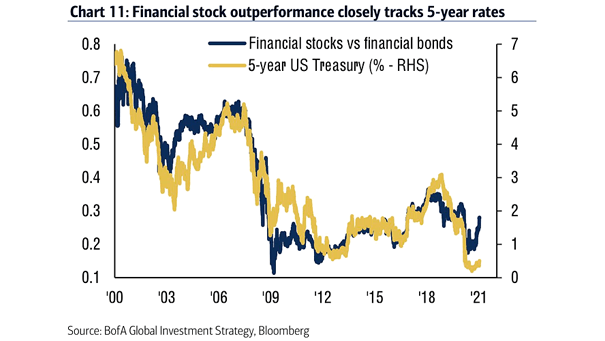
Financial Stocks vs. Financial Bonds and 5-Year U.S. Treasury Bond Financial stock outperformance tends to track 5-year rates. Image: BofA Global Investment Strategy
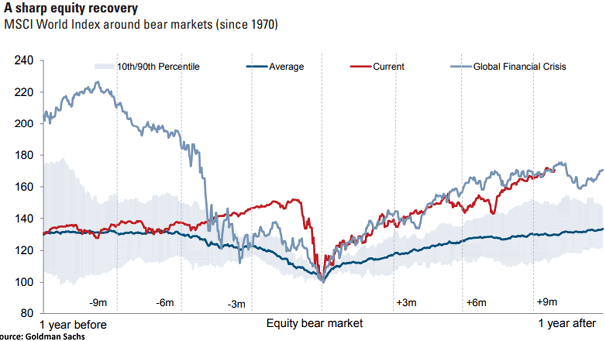
MSCI World Recoveries out of Bear Markets since 1970 After the shortest, and one of the sharpest bear markets in history, the MSCI World recovery is comparable to post-Global Financial Crisis. Image: Goldman Sachs Global…
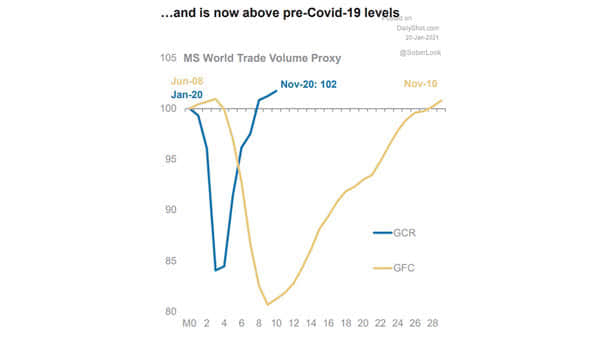
World Trade Volume Proxy World trade has rebounded faster than after the financial crisis of 2008, and is now pre-Covid-19 levels. Image: Morgan Stanley Research
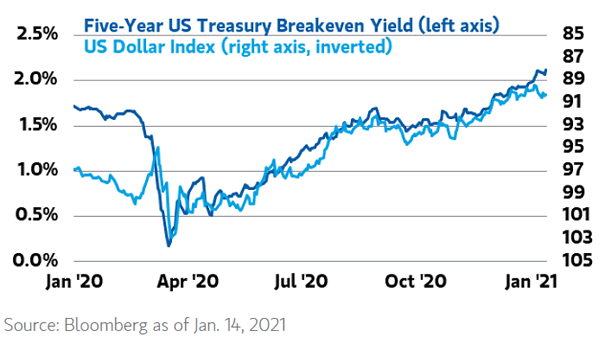
U.S. Dollar Index and Five-Year U.S. Treasury Breakeven Yield U.S. dollar weakness over the last year has almost perfectly tracked inflation expectations. Image: Morgan Stanley Wealth Management
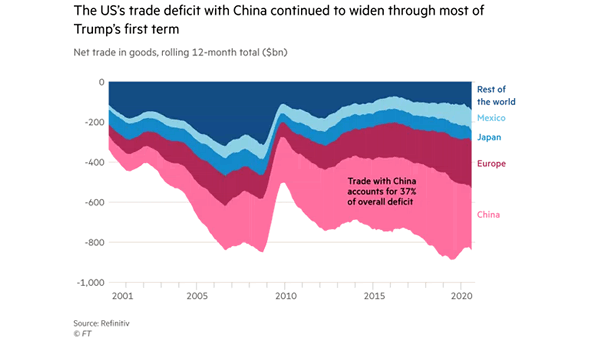
U.S. Trade Deficit Tariffs did not reduce the US’s trade deficit with China. Image: Financial Times
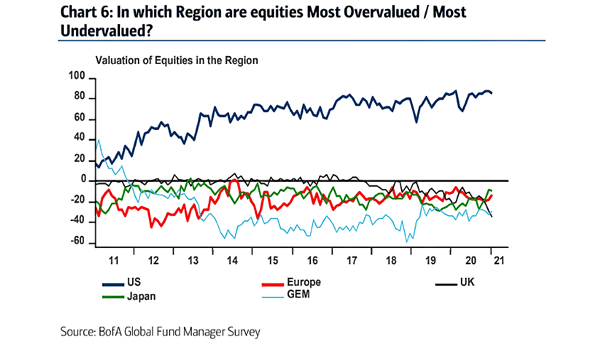
Valuation of Equities in the Region FMS investors think the U.S. equity market is the most overvalued region. Image: BofA Global Fund Manager Survey
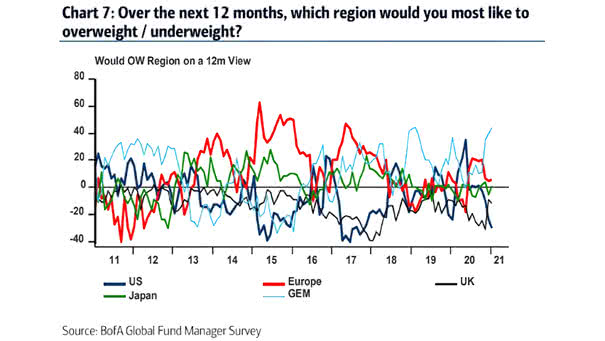
FMS Investors – Global Emerging Markets FMS investors expect to overweight global emerging markets over the next 12 months. Image: BofA Global Fund Manager Survey
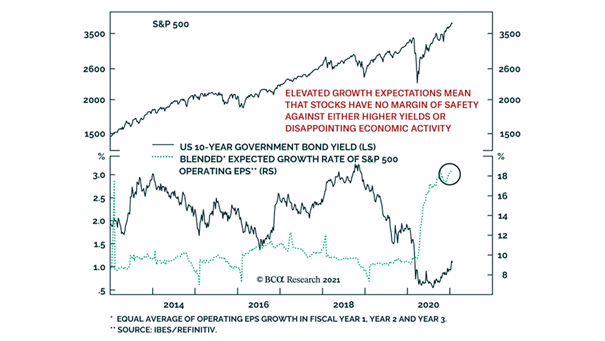
S&P 500, U.S. 10-Year Government Bond Yield and Blended Expected Growth Rate of S&P 500 Operating EPS The S&P 500 is vulnerable to higher yields or disappointing economic activity. Image: BCA Research