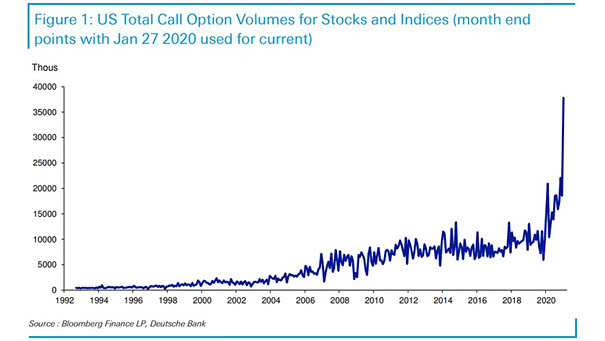
U.S. Total Call Option Volumes for Stocks and Indices
U.S. Total Call Option Volumes for Stocks and Indices U.S. total call option volume for stocks and indices is continuing to soar. Will this end well? Image: Deutsche Bank
U.S. Total Call Option Volumes for Stocks and Indices U.S. total call option volume for stocks and indices is continuing to soar. Will this end well? Image: Deutsche Bank
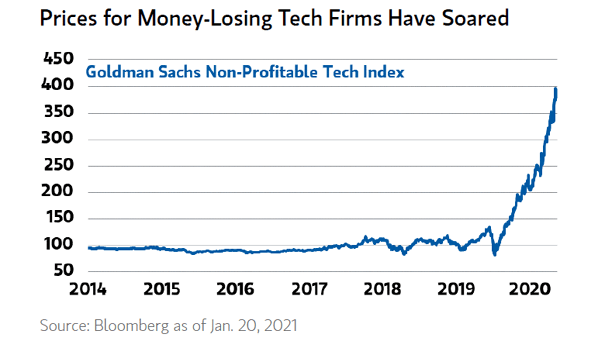
Non-Profitable U.S. Tech Companies The stock prices of non-profitable U.S. tech companies are at record highs. Should investors be worried? Image: Morgan Stanley Wealth Management
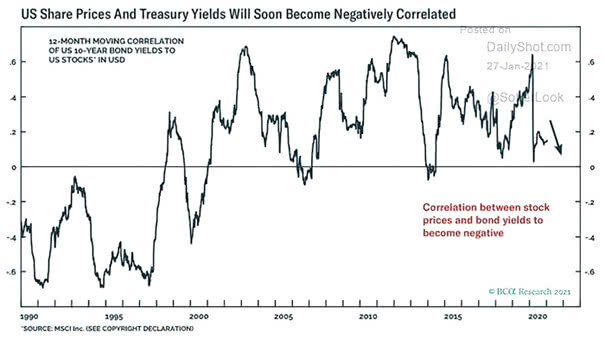
12-Month Moving Correlation of U.S. 10-Year Bond Yields to U.S. Stocks in USD The correlation between U.S. stocks and bond yields should soon become negative. Image: BCA Research
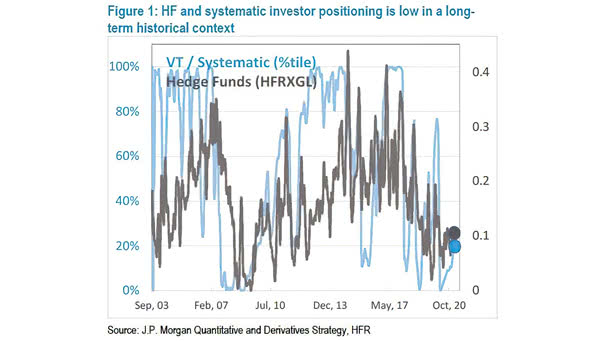
Hedge Funds and Systematic Investor Positioning Hedge funds and systematic investor positioning is low in a long-term historical context. Is any market pullback a buying opportunity? Image: J.P. Morgan Quantitative and Deratives Strategy
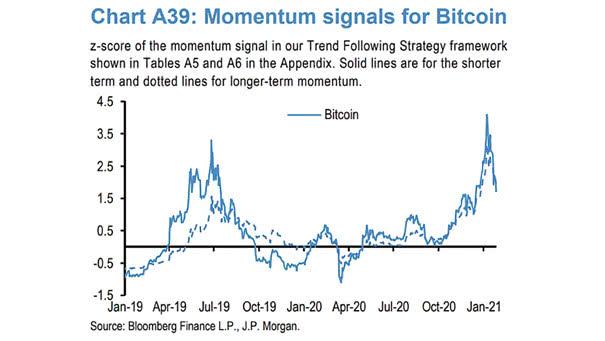
Momentum Signals for Bitcoin Is the Bitcoin fever starting to break? Image: J.P. Morgan
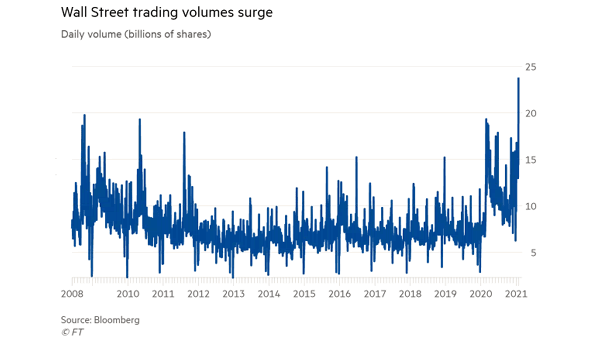
U.S. Stock Market’s Daily Volume U.S. stock trading volumes surge, as retail investors face down hedge funds. Image: Financial Times
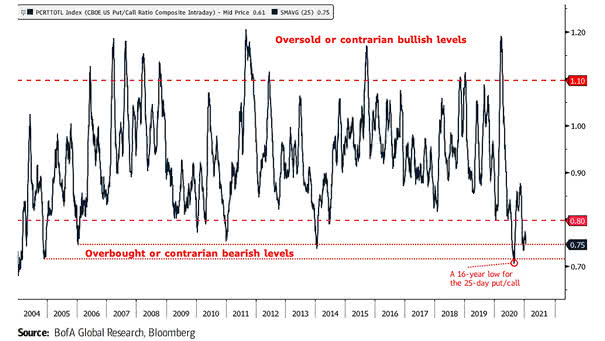
Sentiment – 25-Day U.S. Put/Call Ratio Bearish seasonality risk is increasing, as the 25-day put/call ratio is trading at relatively low levels. Image: BofA
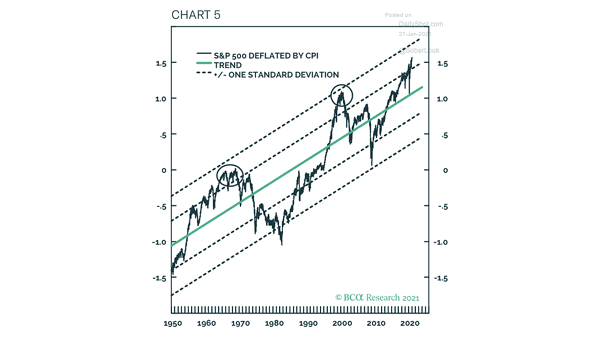
S&P 500 Deflated by CPI and Trend Is the S&P 500 in a bubble disconnected from reality? Image: BCA Research
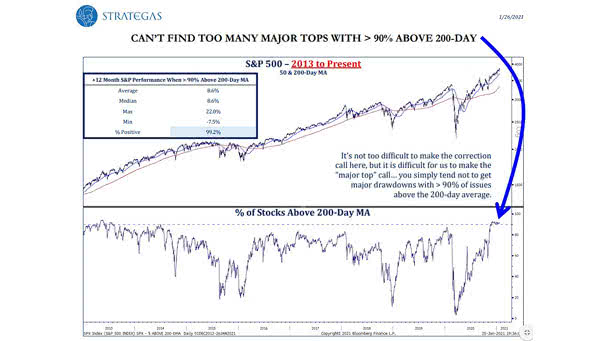
S&P 500 and % of Stocks Above 200-Day Moving Average When more than 90% of stocks are above their 200-day moving average, the S&P 500 tends to be positive over a 12-month period. Image: Strategas…
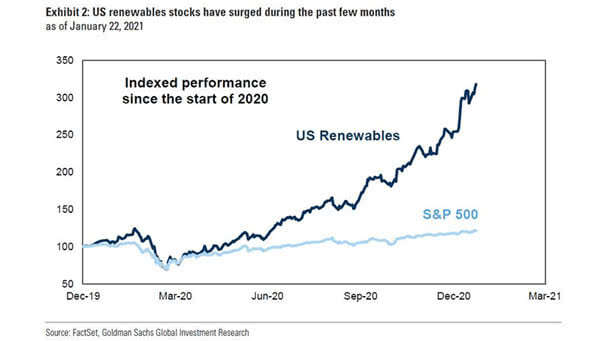
Performance – U.S. Renewables Stocks and S&P 500 U.S. renewables stocks have outperformed the S&P 500 by a large margin during the past 12 months. Image: Goldman Sachs Global Investment Research
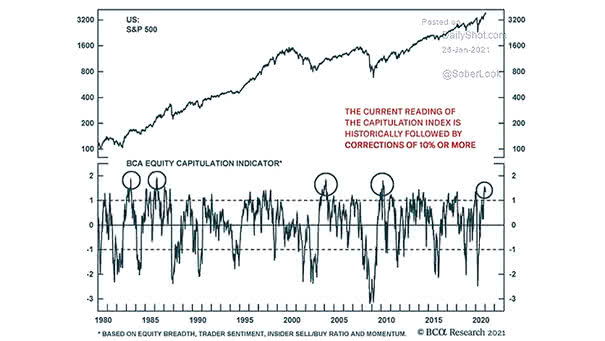
S&P 500 and Equity Capitulation Indicator Should investors expect a stock market correction of 10% or more? Image: BCA Research