U.S. Inflation Expectation – 30-Year Breakeven Rate
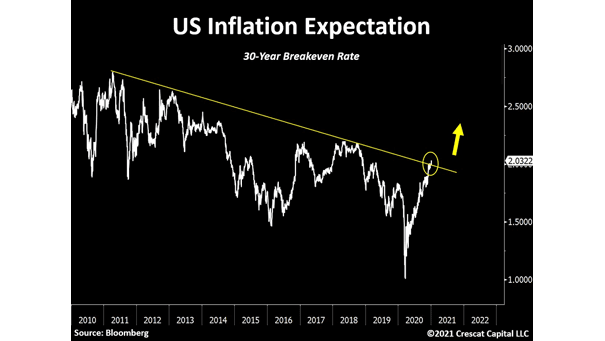
U.S. Inflation Expectation – 30-Year Breakeven Rate Is inflation coming back in the United States? Image: Crescat Capital LLC
U.S. Inflation Expectation – 30-Year Breakeven Rate Is inflation coming back in the United States? Image: Crescat Capital LLC
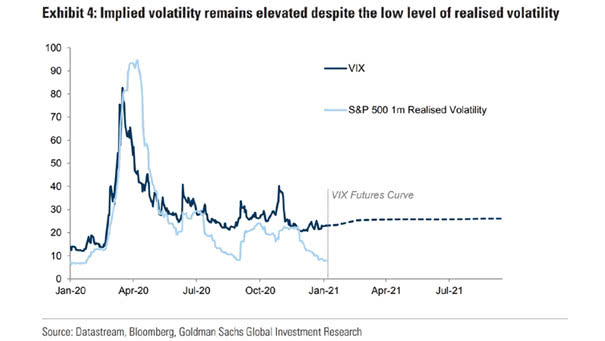
VIX and S&P 500 1-Month Realized Volatility Implied volatility remains elevated despite the equities rally. Image: Goldman Sachs Global Investment Research
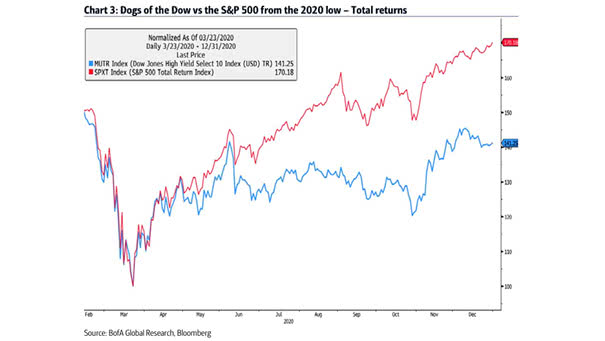
Performance – Dogs of the Dow vs. S&P 500 from the 2020 Low The Dogs of the Dow (10 highest yielding stocks in the Dow Jones) are lagging the S&P 500 from the March low.…
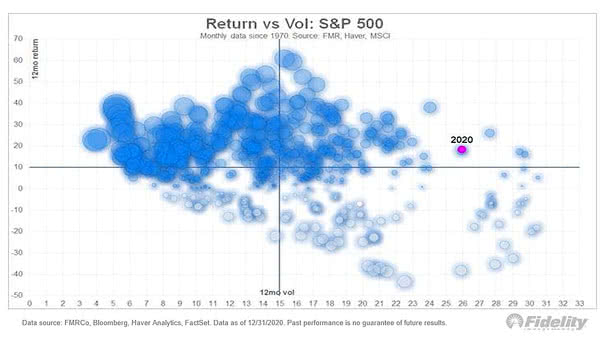
S&P 500 – Return vs. Volatility Despite above average volatility, the coronavirus pandemic drove strong market gains in 2020. Image: Fidelity Investments
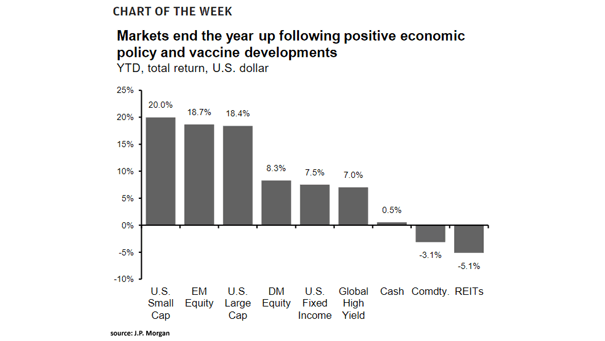
Markets Total Return in 2020 The coronavirus pandemic drove strong market gains in 2020, thanks to unprecedented monetary and fiscal stimulus, as well as positive news on vaccine development. Image: J.P. Morgan Asset Management
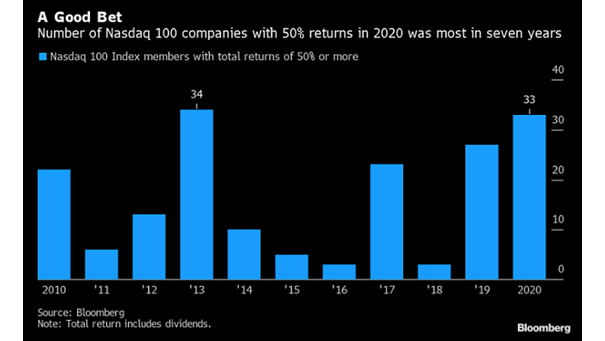
Number of Nasdaq 100 Companies with 50% Returns Since 2010 Which companies in the Nasdaq 100 will be a good bet in 2021? Image: Bloomberg
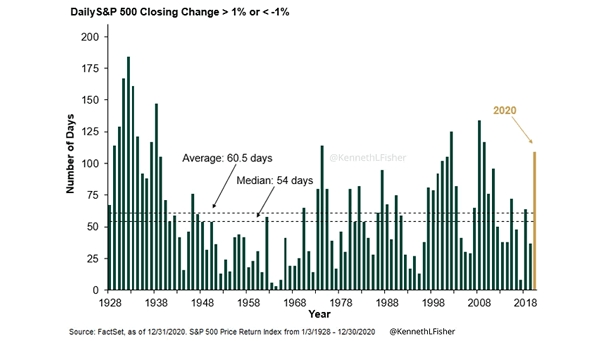
Volatility – Daily S&P 500 Closing Change > 1% or < -1% The S&P 500 Total Return has gained 18.40% in 2020, despite above average volatility. Image: Ken Fisher, Fisher Investments
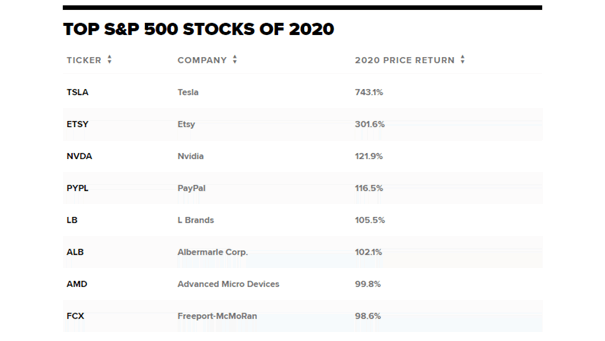
Top S&P 500 Stocks of 2020 Is Tesla stock overvalued or a buy for 2021? Image: CNBC
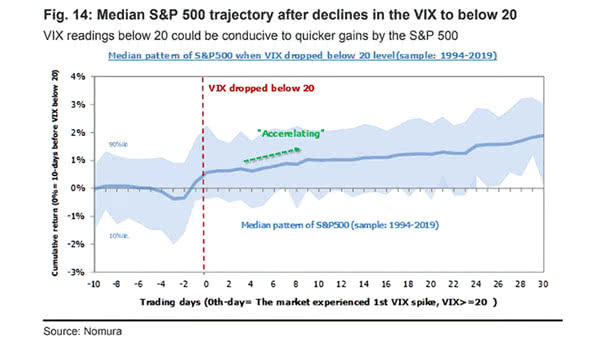
Median S&P 500 Trajectory After Declines in the VIX to Below 20 S&P 500 returns tend to accelerate when the VIX drops below 20 level. Image: Nomura
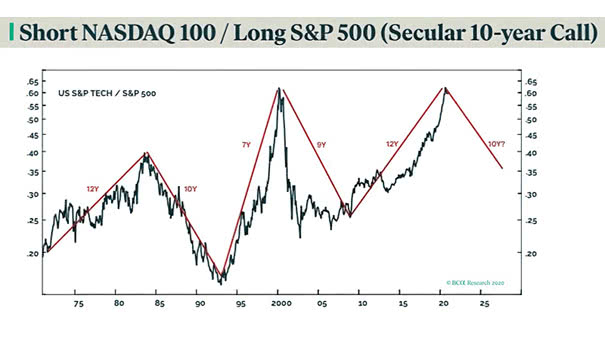
Nasdaq 100 – U.S. S&P Tech / S&P 500 Has technology reached its peak after the massive run in 2020? Image: BCA Research
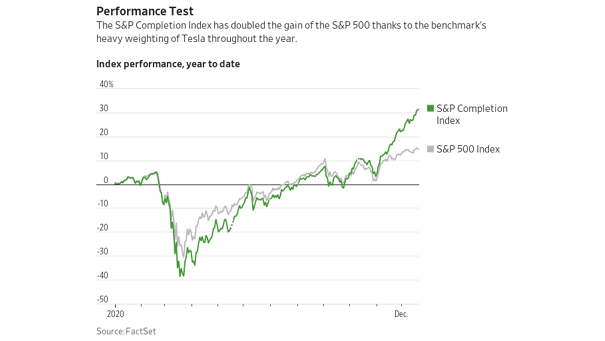
Performance – S&P 500 Completion Index vs. S&P 500 Index The S&P 500 Completion Index, which tracks U.S. mid, small, and micro-cap stocks not included in the S&P 500 Index, has outperformed YTD, thanks to…