U.S. Zombie Companies and Debt
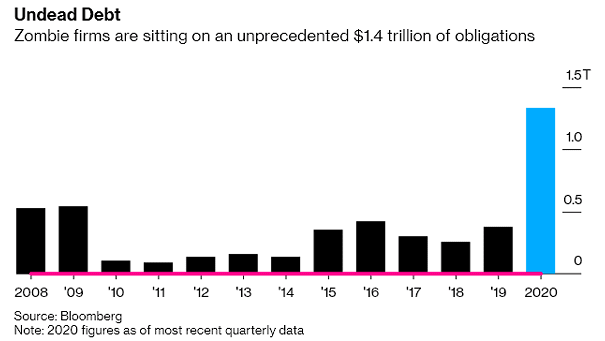
U.S. Zombie Companies and Debt The cost of extended monetary easing: U.S. zombie companies have accumulated $1.4 trillion of debt. Image: Bloomberg
U.S. Zombie Companies and Debt The cost of extended monetary easing: U.S. zombie companies have accumulated $1.4 trillion of debt. Image: Bloomberg
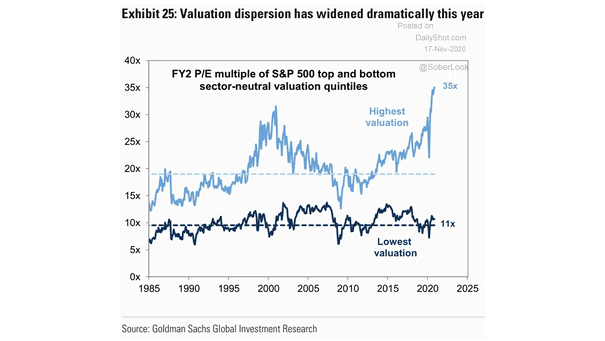
FY2 P/E Multiple of S&P 500 Top and Bottom Sector-Neutral Valuation Quintiles The valuation dispersion for stocks in the S&P 500 is historically high. Image: Goldman Sachs Global Investment Research
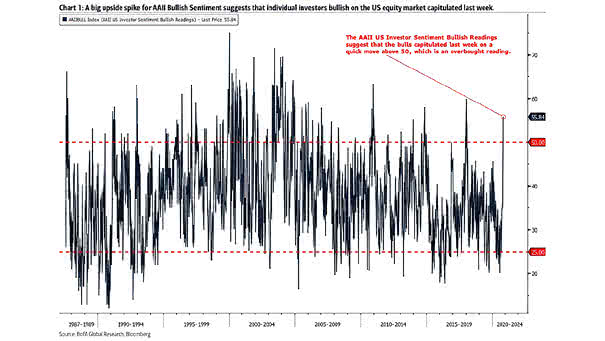
AAII Bullish Sentiment Above 50 Historically, a reading above 50 for the AAII Bullish Sentiment is contrarian bearish. Image: BofA Global Research
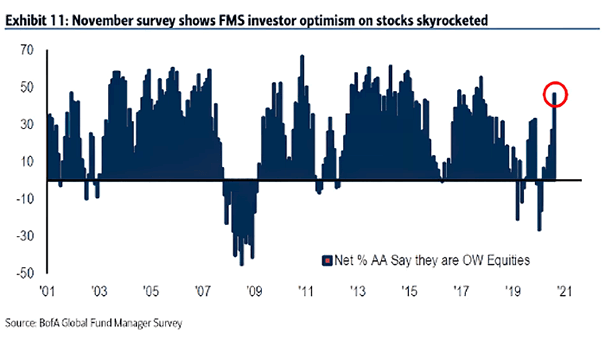
Sentiment – FMS Investor Optimism on Stocks Is it time to sell on vaccine news, as BofA suggests? Image: BofA Global Fund Manager Survey
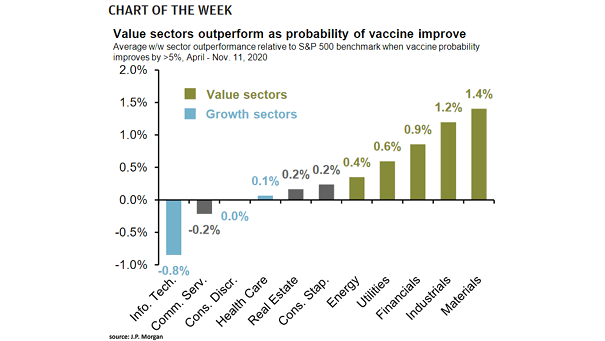
Performance – Value Sectors vs. Growth Sectors When the probability of an effective vaccine has increased, value sectors have outperformed the S&P 500 index while growth sectors have lagged. Image: J.P. Morgan Asset Management
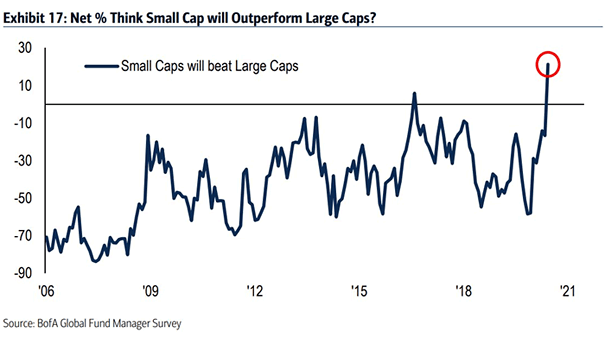
FMS Investors – Net % Think Small Caps will Outperform Large Caps Historically, small caps tend to outperform large caps after recessions. Image: BofA Global Fund Manager Survey
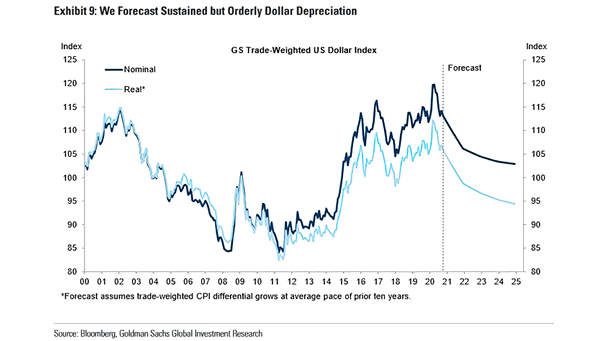
Trade-Weighted U.S. Dollar Index Goldman Sachs expects the depreciation in the broad U.S. dollar to continue in 2021 and beyond. Image: Goldman Sachs Global Investment Research
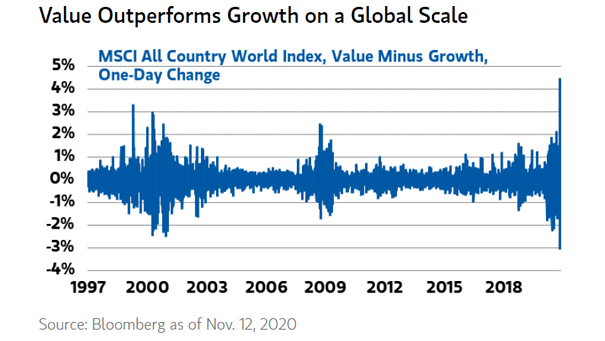
MSCI All Country World Index (MSCI ACWI) – Value Minus Growth, One-Day Change Should investors forget growth stocks, as value investing is back in play? Image: Morgan Stanley Wealth Management
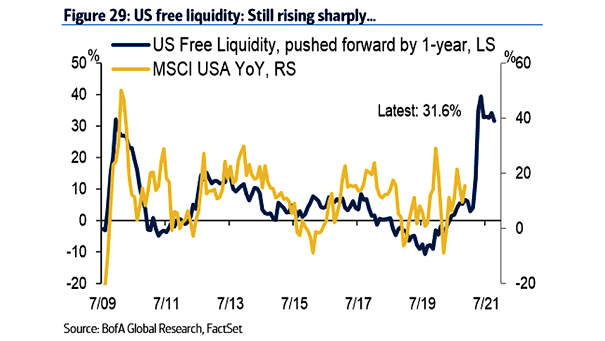
Stocks – U.S. Free Liquidity and MSCI USA YoY Should investors expect more upside for U.S. stocks, as U.S. free liquidity continues to rise? Image: BofA Global Research
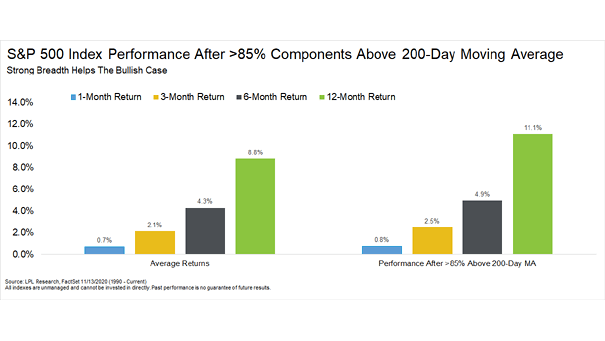
S&P 500 Index Performance After >85% Components Above 200-Day Moving Average More than 85% of stocks above their 200-day moving average is historically bullish. Image: LPL Research
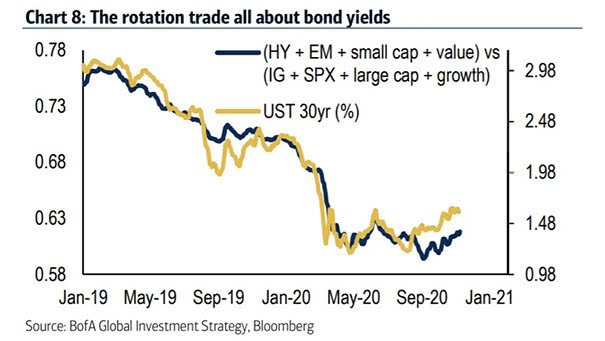
Bond Yields and Rotation Trade Higher yields are good news for investors. According to BofA, the bull story next year is a reopening rotation story. Image: BofA Global Investment Strategy