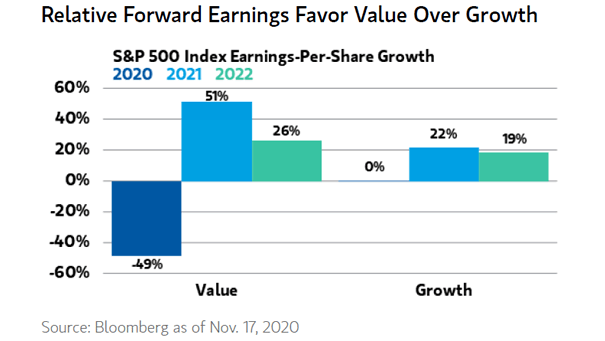
Value vs. Growth – S&P 500 Index Earnings-Per-Share Growth
Value vs. Growth – S&P 500 Index Earnings-Per-Share Growth EPS growth helps to explain why value stocks could outperform growth stocks in 2021. Image: Morgan Stanley Weath Management
Value vs. Growth – S&P 500 Index Earnings-Per-Share Growth EPS growth helps to explain why value stocks could outperform growth stocks in 2021. Image: Morgan Stanley Weath Management
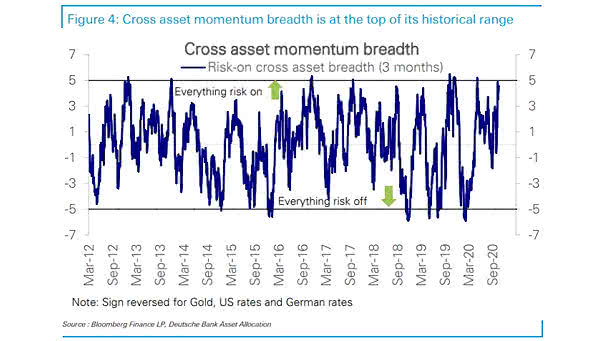
Cross Asset Momentum Breadth Risk-on is still strong. Are investors too optimistic? Image: Deutsche Bank Asset Allocation
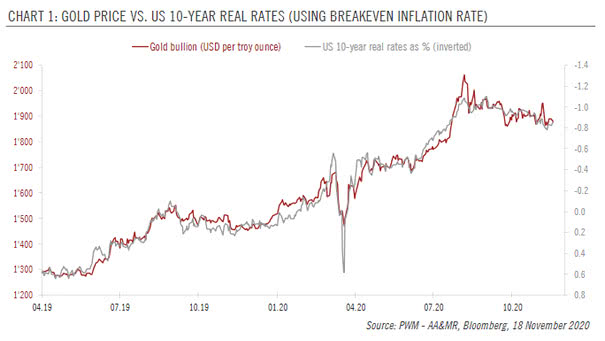
Gold Price vs. U.S. 10-Year Real Rates (Using Breakeven Inflation Rate) Pictet expects gold prices to reach new highs to US$2,150/oz in the next 12 months. Image: Pictet Wealth Management
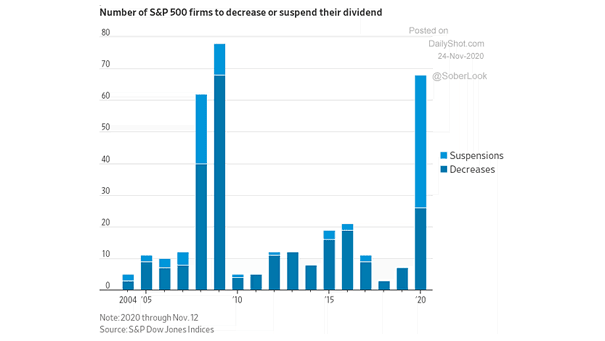
Number of S&P 500 Firms to Decrease or Suspend their Dividend Bye-bye dividends, as they have been hit hard by the coronavirus pandemic. Image: The Wall Street Journal
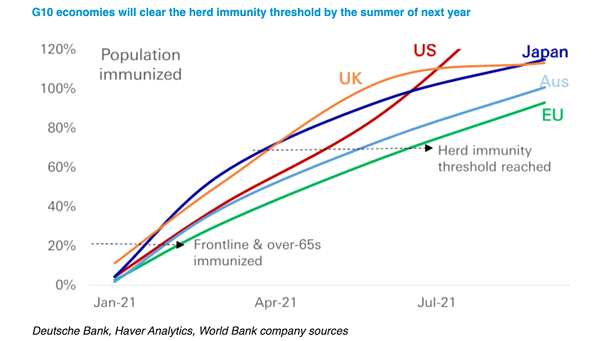
Coronavirus Pandemic and Population Immunized in 2021 G10 economies are expected to achieve herd immunity by the next summer. Image: Deutsche Bank
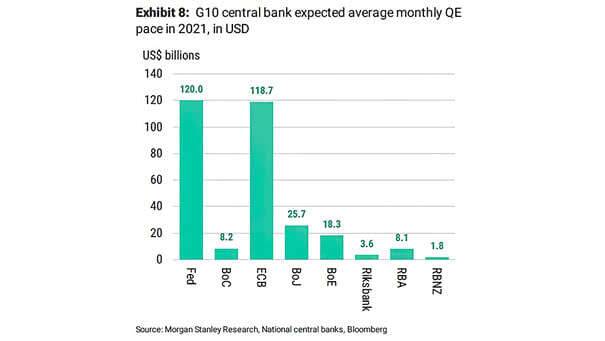
G10 Central Bank Expected Average Monthly Quantitative Easing (QE) in 2021 Central banks are expected to provide more liquidity to markets in 2021. Image: Morgan Stanley Research
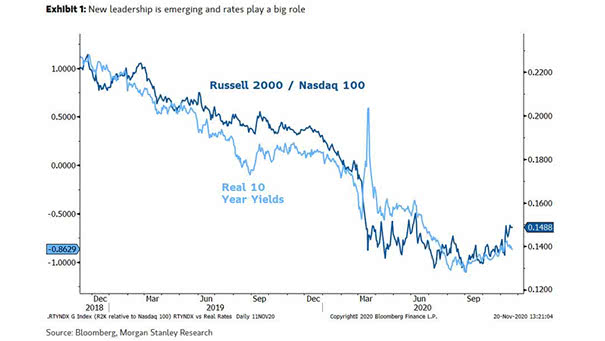
Cyclical Stocks – Russell 2000 / Nasdaq 100 and U.S. 10-Year Real Yields Chart suggesting that the stock rotation should continue as cyclical stocks perform better from higher interest rates and better growth. Image: Morgan…
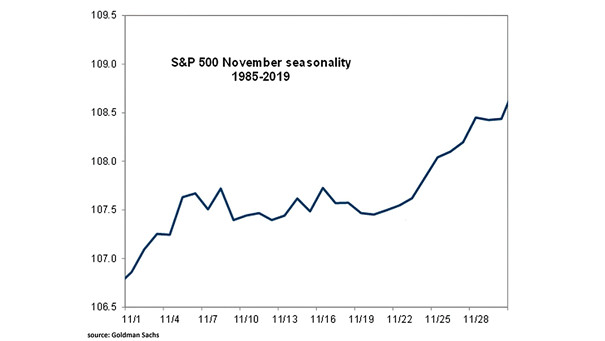
S&P 500 November Seasonality Can investors expect a Thanksgiving rally this year? Image: Goldman Sachs Global Investment Research
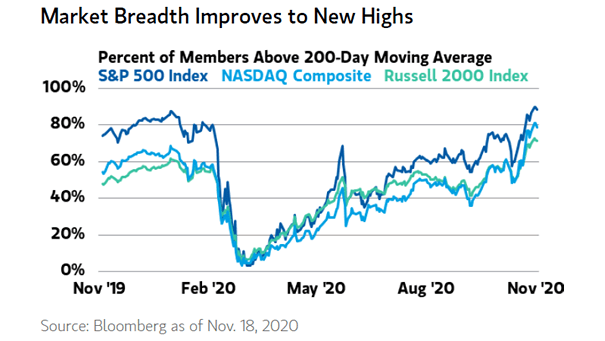
Market Breadth – Percent of Members Above 200-Day Moving Average Market breadth has improved dramatically. 85% of S&P 500 stocks above the 200-day moving average is historically bullish. Image: Morgan Stanley Weath Management
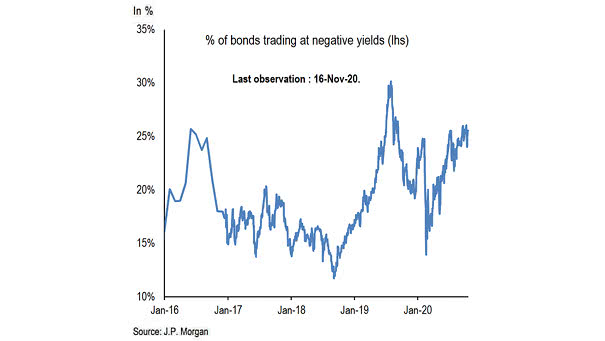
% of Bonds Trading at Negative Yields Bonds that are trading at negative yields jump again. Image: J.P. Morgan

Performance – All Weather Portfolio (Stocks, Bonds, Cash and Gold) The All Weather Portfolio of 25/25/25/25 in stocks, bonds, cash and gold is up 14% YTD, well above its historical annual average of 6%. Image:…