S&P 500 – Bullish Head and Shoulders
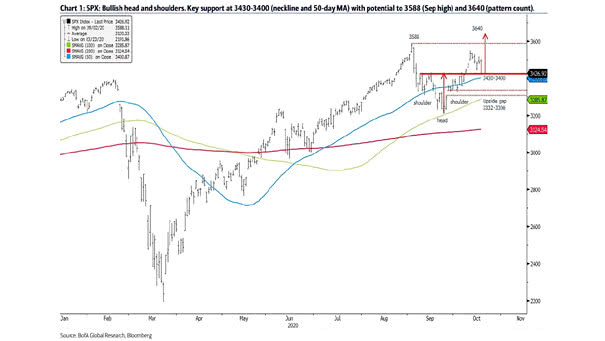
S&P 500 – Bullish Head and Shoulders If supports hold, the S&P 500 could have bullish breakouts with upside potential to 3588 and then 3640. Image: BofA Global Research
S&P 500 – Bullish Head and Shoulders If supports hold, the S&P 500 could have bullish breakouts with upside potential to 3588 and then 3640. Image: BofA Global Research
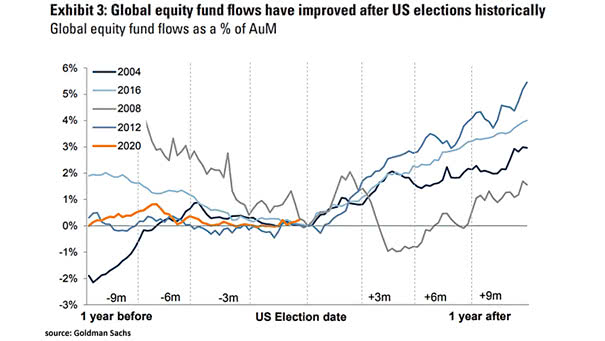
Global Equity Fund Flows and U.S. Elections Historically, global equity fund flows have improved after U.S. elections. Image: Goldman Sachs Global Investment Research
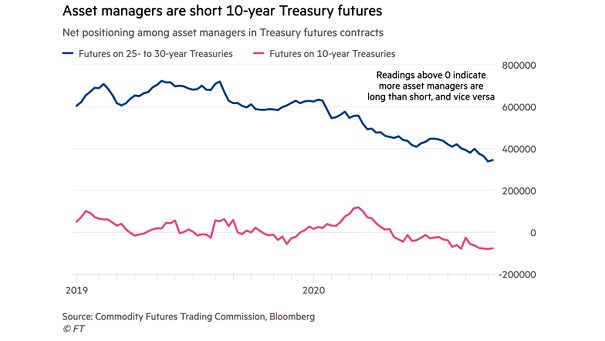
Net Positioning Among Asset Managers in Treasury Futures Contracts Investors expect higher long-term bond yields as the economy improves in the future. Image: Financial Times
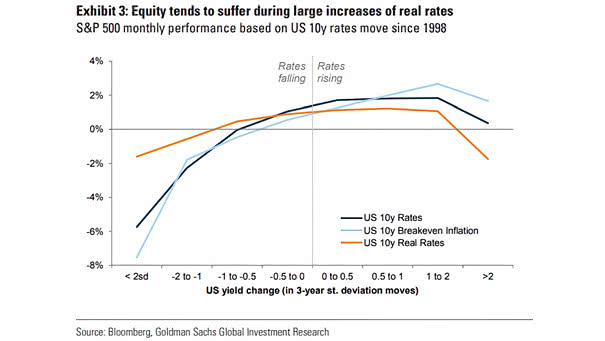
S&P 500 Monthly Performance Based on U.S. 10-Year Rates Move Since 1998 Historically, large increases of real rates tend to weigh on equities. Image: Goldman Sachs Global Investment Research
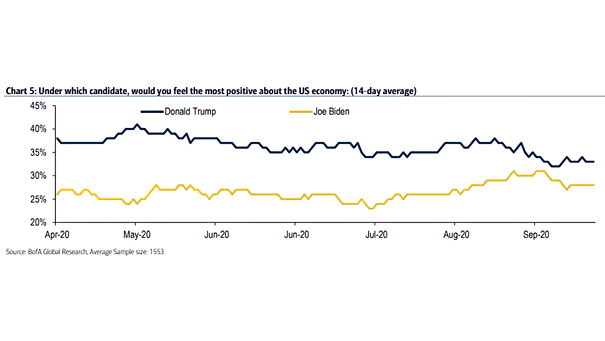
U.S. Election – Donald Trump vs. Joe Biden and the U.S. Economy Americans think that Donald Trump will be better for the U.S. economy if he is re-elected rather than if Joe Biden is elected.…
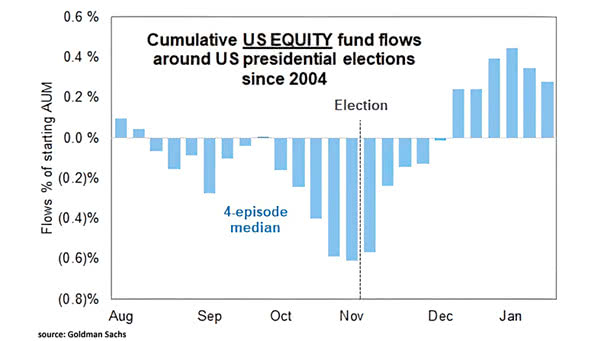
Cumulative U.S. Equity Fund Flows Around U.S. Presidential Elections Since 2004 Positive flows into U.S. equity funds could support a further rise in the S&P 500 after the U.S. presidential election. Image: Goldman Sachs Global…
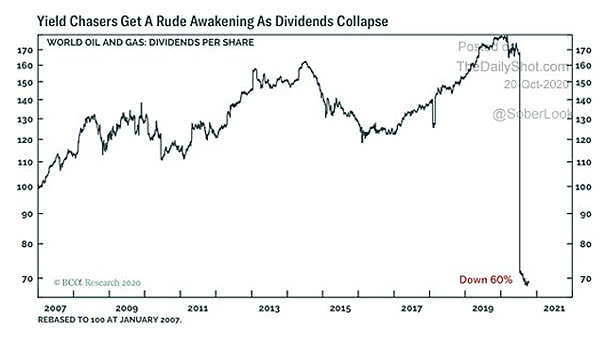
World Oil and Gas: Dividends per Share The ongoing collapse of dividends is unprecedented. Image: BCA Research
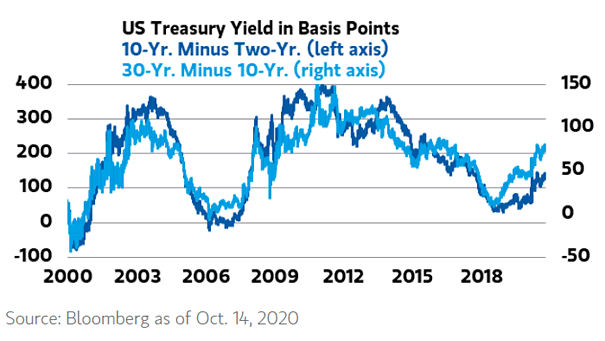
U.S. Treasury Yield – 10Y-2Y vs. 30Y-10Y Morgan Stanley forecasts the 10-year Treasury yield at about 1% by the end of the year. Image: Morgan Stanley Wealth Management
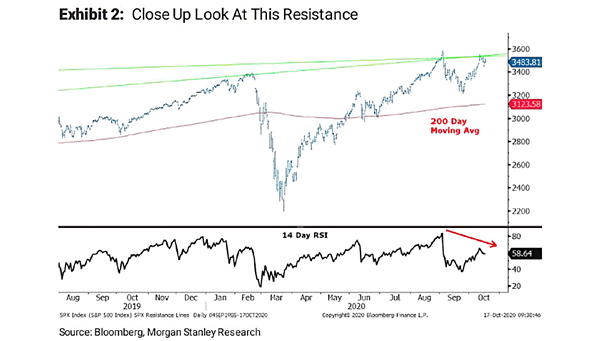
S&P 500 Key Support at the 200-Day Moving Average According to Morgan Stanley, the correction that began in September is likely not complete. Morgan Stanley sees the 200-day moving average as a strong support. Image:…
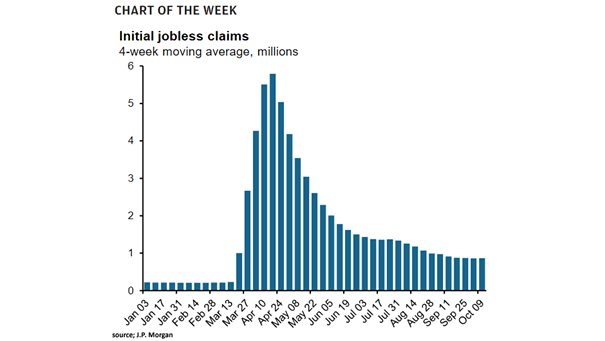
U.S. Labor Market – Initial Jobless Claims The four-week moving average of jobless claims ticked higher, suggesting that the road to recovery is a long journey. Image: J.P. Morgan Asset Management
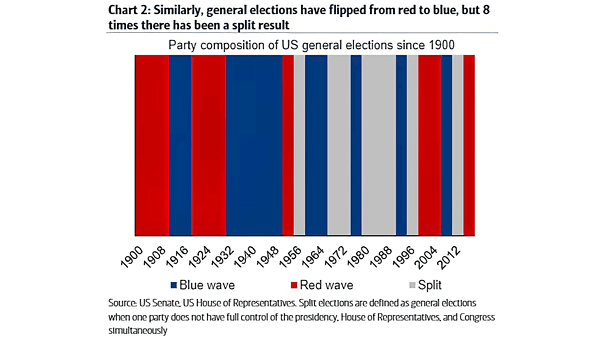
Party Composition of U.S. General Elections Since 1900 Since 1900, the U.S. general elections have seen 12 blue waves and 10 red waves, but 8 times there has been a split result. Image: BofA