Median S&P 500 Return by Month during Presidential Election Years
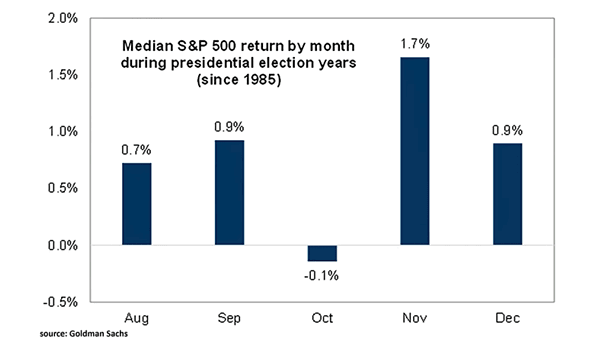
Median S&P 500 Return by Month during Presidential Election Years Can investors expect a year-end rally this year? Image: Goldman Sachs Global Investment Research
Median S&P 500 Return by Month during Presidential Election Years Can investors expect a year-end rally this year? Image: Goldman Sachs Global Investment Research
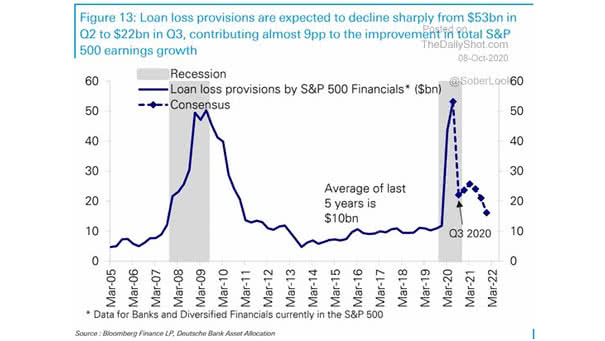
Loan Loss Provisions by S&P 500 Financials Should investors love bank stocks, as loan loss provisions are expected to decline sharply? Image: Deutsche Bank Asset Alloation
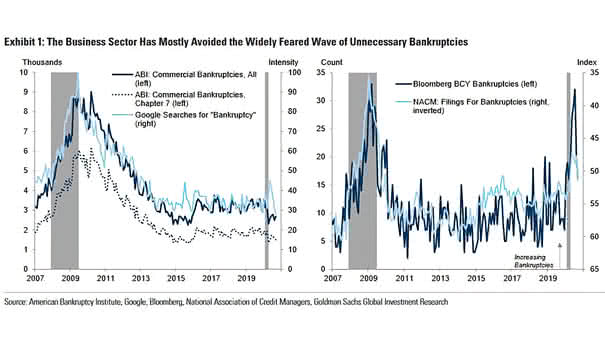
Coronavirus Crisis and Bankruptcies U.S. business bankruptcies are declining significantly. Image: Goldman Sachs Global Investment Research
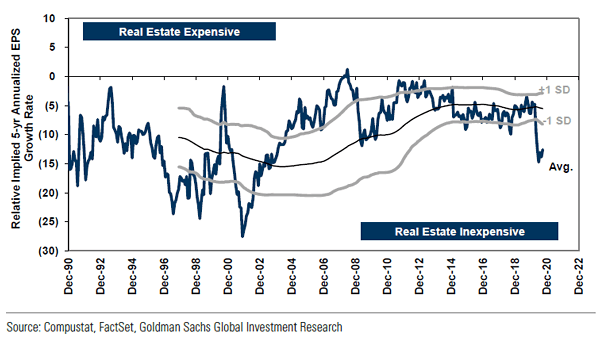
Valuation – S&P 500 Real Estate Sector Real estate appears to be very undervalued. Image: Goldman Sachs Global Investment Research
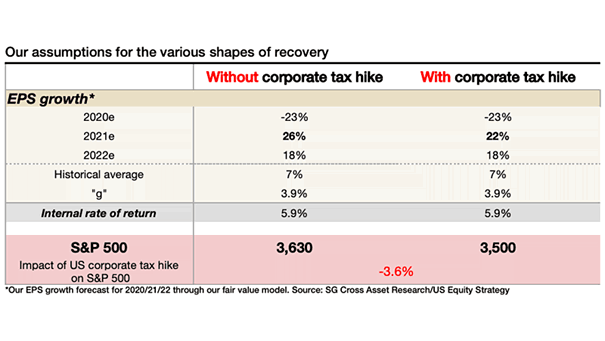
Impact of U.S. Corporate Tax Hike on S&P 500 This table suggests the impact on the S&P 500 if Joe Biden won the election and the Democrats swept both houses of Congress. Image: Societe Generale…
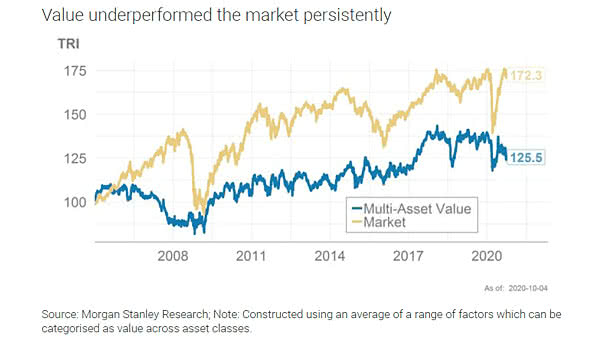
Market vs. Multi-Asset Value Chart showing the painful decade for value. Has value lost its mojo? Image: Morgan Stanley Research
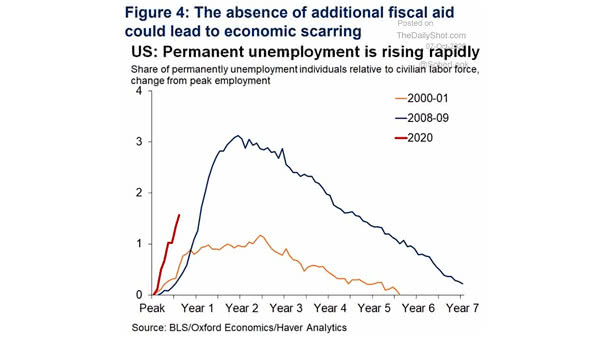
U.S. Permanent Unemployment More layoffs become permanent as the coronavirus persists. Image: Oxford Economics
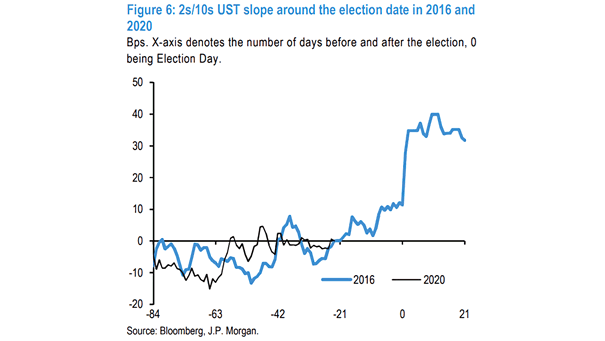
Yield Curve – 2s-10s U.S. Treasury Slope Around the U.S. Election Date in 2016 and 2020 The U.S. Treasury yield curve could steepen following the presidential election. Image: J.P. Morgan
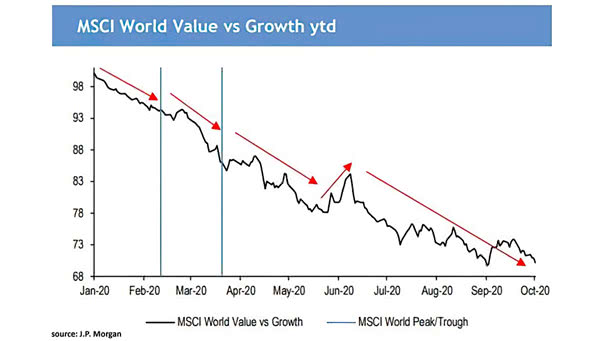
MSCI World Value vs. Growth YTD Will global value stocks continue to underperform global growth stocks, as the global economy rebounds? Image: J.P. Morgan
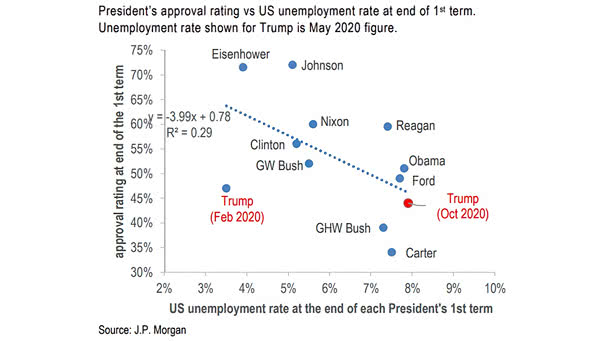
U.S. Election – President’s Approval Rating vs. U.S. Unemployment Rate at the End of First Term President Donald Trump’s approval rating is in line with the U.S. unemployment rate. Image: J.P. Morgan
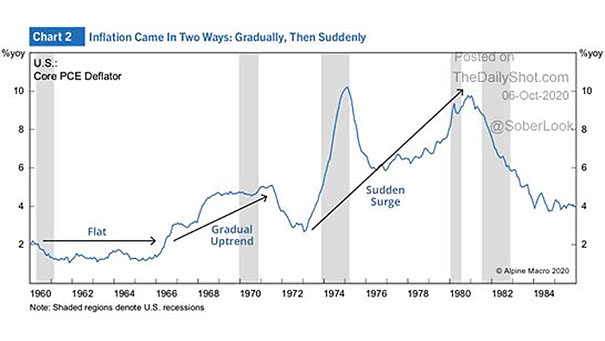
Inflation – U.S. Core PCE Deflator This chart could suggest more inflation ahead. Image: Alpine Macro