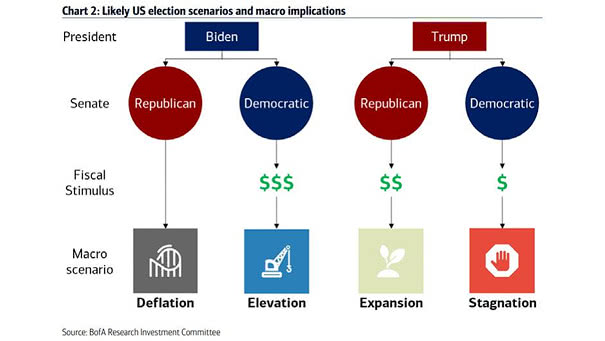
Likely U.S. Election Scenarios and Macro Implications
Likely U.S. Election Scenarios and Macro Implications Is it time to say goodbye to a big fiscal stimulus package? Image: BofA Research Investment Committee
Likely U.S. Election Scenarios and Macro Implications Is it time to say goodbye to a big fiscal stimulus package? Image: BofA Research Investment Committee
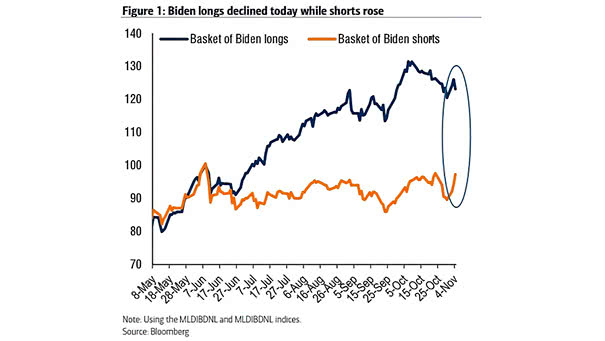
Stocks – Basket of Biden Longs vs. Basket of Biden Shorts Is no Democratic sweep good news? Biden shorts, like tech and managed care, rose significantly. Image: BofA Global Research
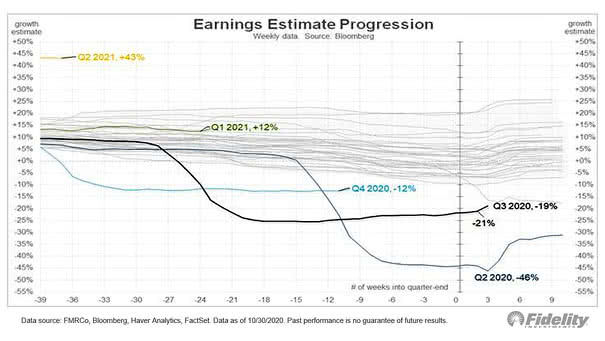
S&P 500 – Earnings Estimate Progression U.S. corporate earnings are not so bad. As the chart shows, earnings fundamentals are improving. Image: Fidelity Investments
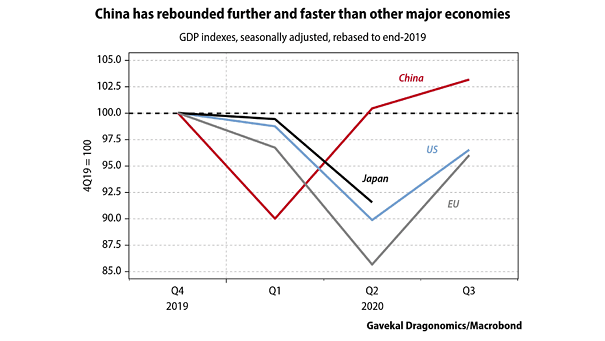
GDP Indexes – China, U.S., Japan and EU China is experiencing a strong V-shaped economic recovery and is expected to provide a boost to the rest of the world. Image: Gavekal, Macrobond
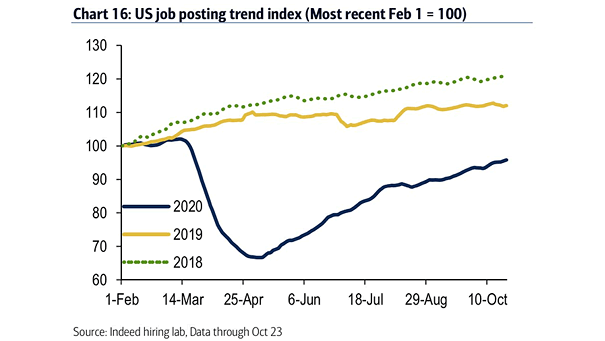
U.S. Job Posting Trend Index This chart highlights the impact of Covid-19 on the U.S. job posting trend. Image: BofA
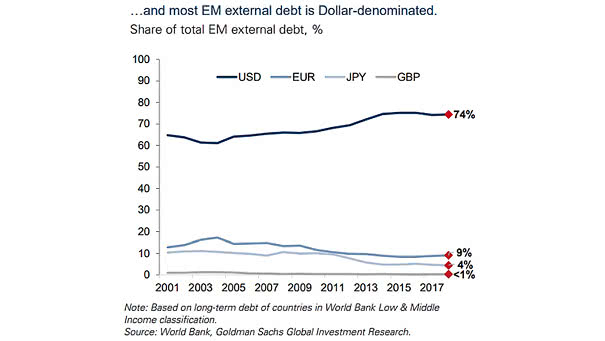
U.S. Dollar and Share of Total Emerging Markets External Debt Emerging markets are vulnerable to a stronger US dollar, as most of the EM external debt is dollar-dominated. Image: Goldman Sachs Global Investment Research
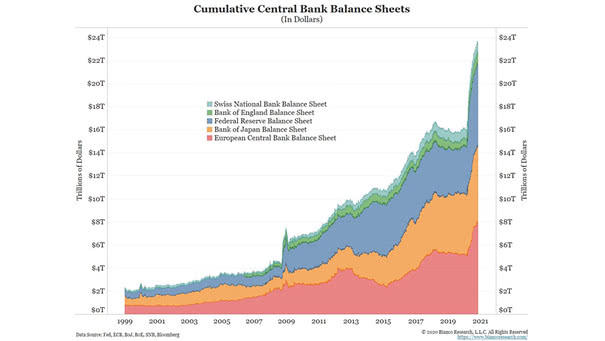
Cumulative Central Bank Balance Sheets Who’s afraid of the balance sheet expansion by central banks? Image: Bianco Research
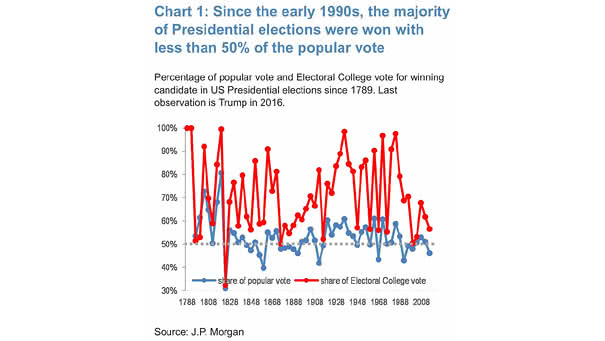
Percentage of Popular Vote and Electoral College Vote for Winning Candidate in U.S. Presidential Elections Since 1789 Winning the popular vote doesn’t ensure victory in the United States. Image: J.P. Morgan
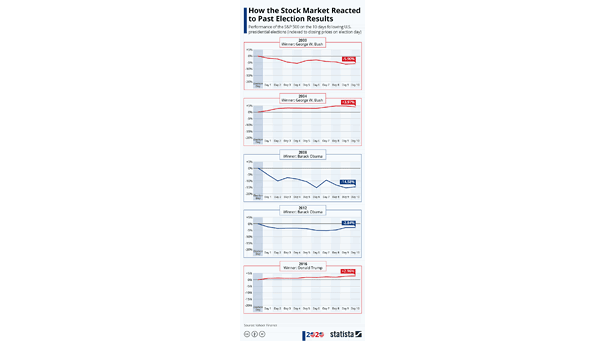
Performance of the S&P 500 on the 10 Days Following U.S. Presidential Elections The S&P 500 has gained an average 1.7% on the 10 days following U.S. Presidential elections since 1944. Image: Statista
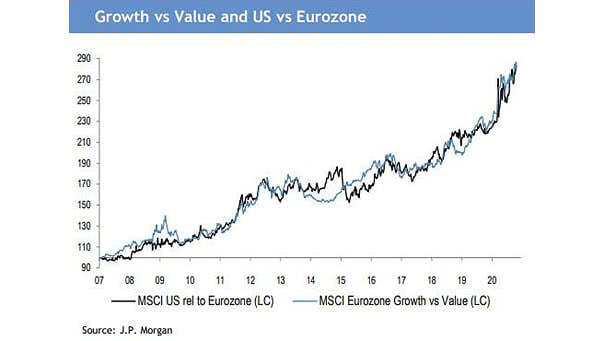
Growth vs. Value and U.S. vs. Eurozone Will growth continue to outperform value in 2021? Image: J.P. Morgan

S&P 500 Returns Across Different Presidents’ First Terms The S&P 500 is up 55% under President Trump. This is the fourth-best return for a first-term president. Image: Bloomberg