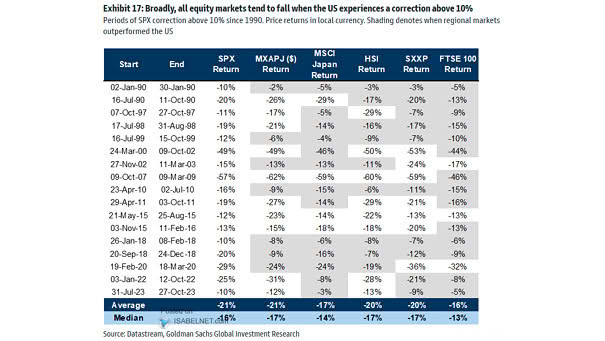
S&P 500 Real Price Index

S&P 500 Real Price Index Since 1871, approximately 40% of the years have seen a negative real price return for the inflation-adjusted S&P500 index. Image: Goldman Sachs Global Investment Research

Net Buys by Size Segment

Net Buys by Size Segment Last week, Bofa’s clients were net sellers of large caps, mid caps and small caps, suggesting a strategic adjustment in portfolio allocations. Image: BofA Securities

Typical Path of S&P 500 Bottom-Up Consensus EPS Estimate

Typical Path of S&P 500 Bottom-Up Consensus EPS Estimate S&P 500 EPS revisions for 2024 are showing a more favorable trend compared to both the previous year, 2023, and the average revisions seen historically, which…

Valuation – S&P 500 Trailing PE

Valuation – S&P 500 Trailing PE After the fall of the Berlin Wall, globalization had a significant impact on various aspects of the global economy, including financial markets, as evidenced by the P/E ratios of…

U.S. Job Openings and S&P 500

U.S. Job Openings and S&P 500 Job openings generally reflect current economic conditions, while the stock market reflects investors’ future expectations. Image: BofA Global Investment Strategy

S&P 500 Performance the Year After a Negative Midterm Year

S&P 500 Performance the Year After a Negative Midterm Year Since 1950, U.S. stocks have consistently gained in a pre-election year and election year following a negative midterm year, giving investors reason to be optimistic…

Weekly Equity Fund Flows

Weekly Equity Fund Flows Equity funds seeing $82 billion inflows over the past 10 weeks indicates the strong confidence investors have in the potential returns in equity markets. Image: BofA Global Investment Strategy