VIX Curve and U.S. Election
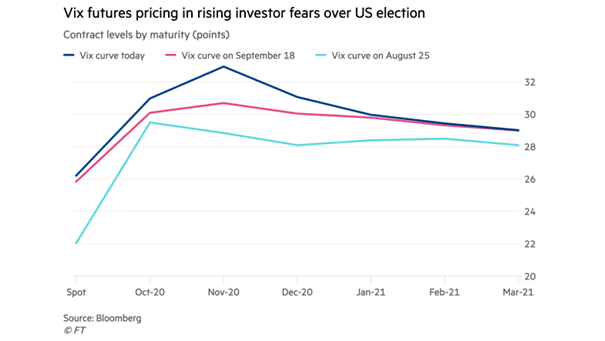
VIX Curve and U.S. Election Investors expect more volatility ahead of the U.S. presidential election. Image: Financial Times
VIX Curve and U.S. Election Investors expect more volatility ahead of the U.S. presidential election. Image: Financial Times
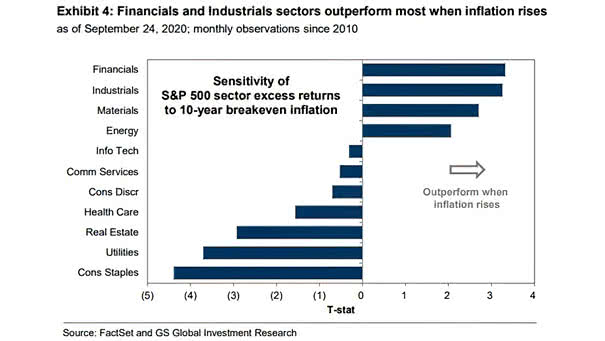
Sensitivity of S&P 500 Sector Excess Returns to 10-Year Breakeven Inflation Financials, industrials, materials and energy sectors outperform most when inflation rises. Image: Goldman Sachs Global Investment Research
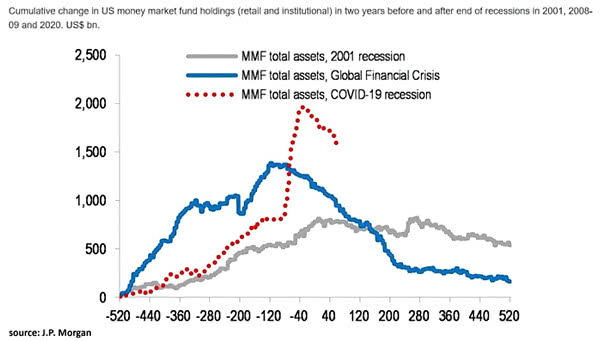
U.S. Money Market Fund Holdings According to J.P. Morgan, the wall of cash may remain very high indefinitely, as defensive assets are delivering their weakest performance. Image: J.P. Morgan
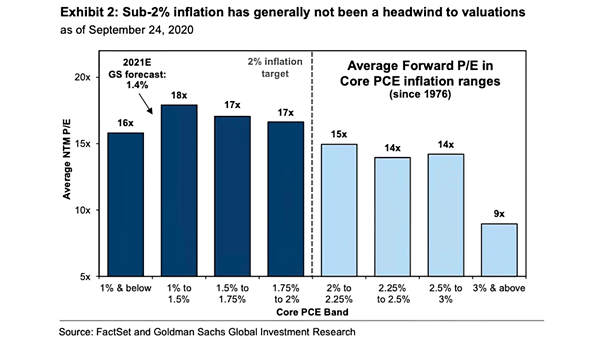
Valuation – Average Forward P/E in Core PCE Inflation Ranges Since 1976 Historically, inflation generally had a negative impact on valuations when core PCE approached 2%, in the anticipation of rate hikes. Image: Goldman Sachs…
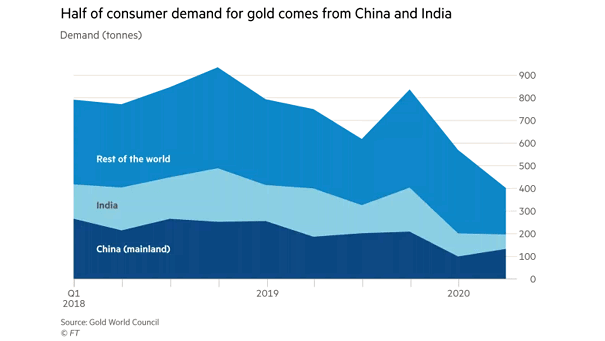
Consumer Demand for Gold China is the world’s largest consumer of gold, and India is the second largest consumer of gold. Image: Financial Times
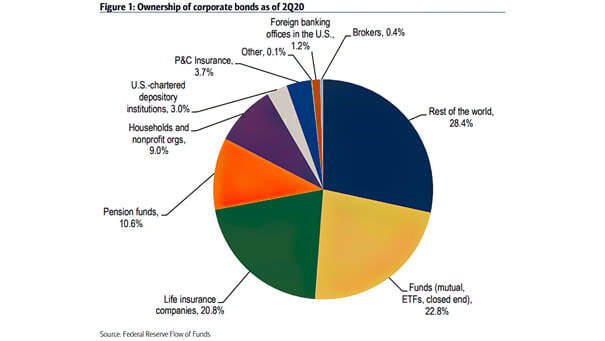
Ownership of U.S. Corporate Bonds Around 28% of U.S. corporate bonds are held by non-U.S. investors. Image: BofA
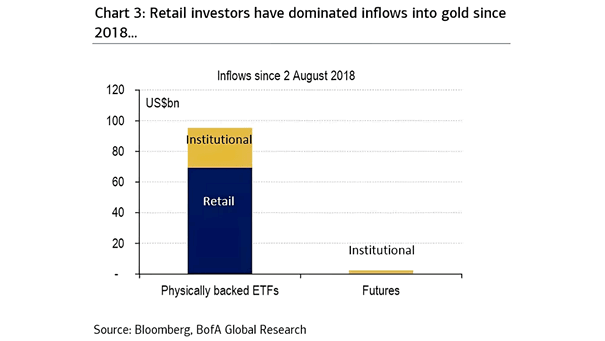
Gold Inflows Since 2018 More retail investors are turning to gold investment. Image: BofA Global Research
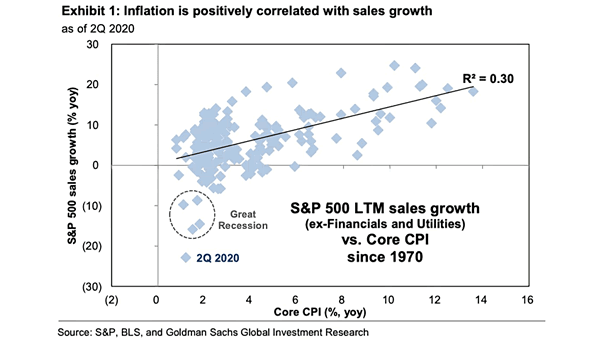
Inflation – S&P 500 LTM Sales Growth vs. Core CPI Since 1970 Rising inflation tends to boost S&P 500 earnings. According to Goldman Sachs, a 100bp increase in average annual core CPI would lift the…
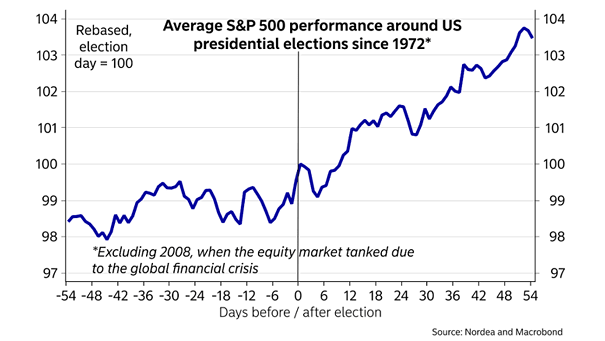
Average S&P 500 Performance Around U.S. Presidential Elections Since 1972 Market volatility is expected to continue ahead of the U.S. presidential election. Image: Nordea and Macrobond
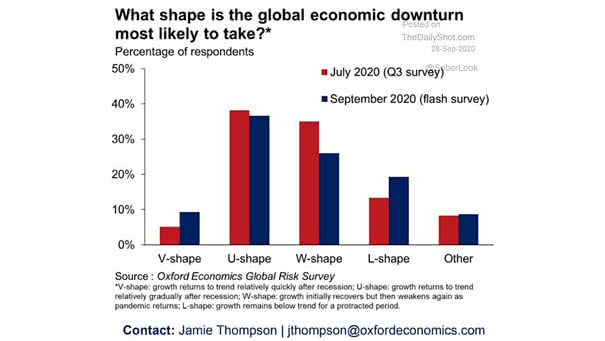
What Shape Is the Global Economic Downturn Most Likely to Take? A V-shaped global economic recovery seems unlikely. Image: Oxford Economics
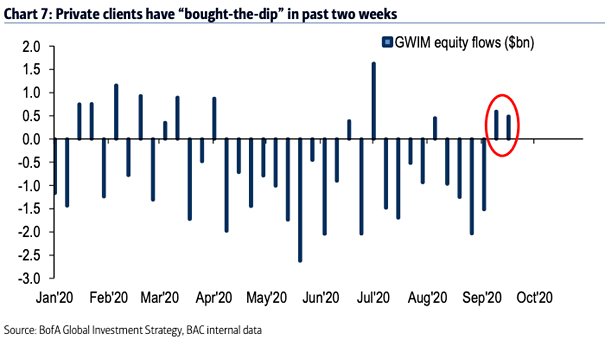
GWIM Equity Flows – Buy the Dip? Time to buy the dip? BofA private clients have bought the dip in the past two weeks. Image: BofA Global Investment Strategy