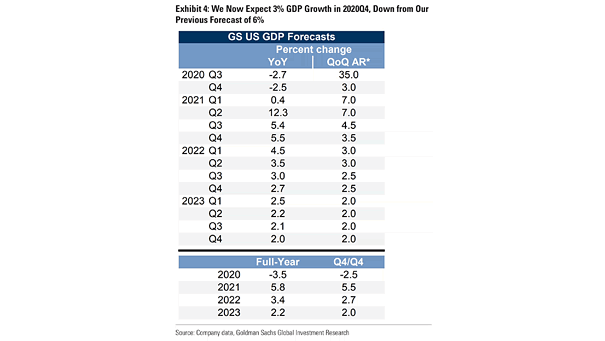
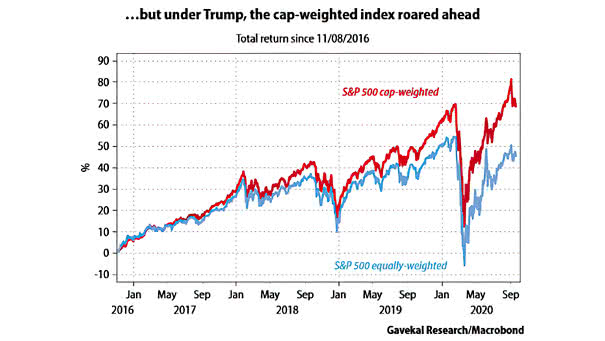
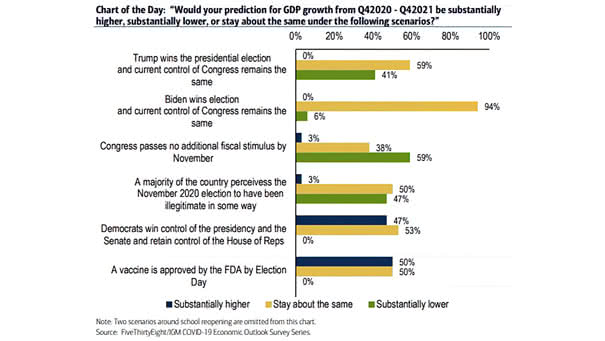
S&P 500 and Long-Term Resistance
S&P 500 and Long-Term Resistance According to Morgan Stanley the correction isn’t over, as stocks get too extended. Image: Morgan Stanley Research
S&P 500 Returns – Obama vs. Trump Two charts comparing Obama’s vs. Trump’s stock market returns. Image: Gavekal, Macrobond
Market-Implied One-Day Move After U.S. Election Day The current expected move after Election Day is 2.8%, down from 3.2% in August. Image: Goldman Sachs Global Investment Research
60/40 Portfolio Annual Return Is a 60/40 portfolio no longer good enough, as valuations are high? Image: Financial Times
Gold and Emerging Markets The gold rally suggests that emerging markets could make a comeback. Image: Morgan Stanley Wealth Management
2020 Returns by Market and Factors Despite the recent pullback, the Nasdaq is up nearly 19% YTD. Image: J.P. Morgan
Eurozone Equity Markets Eurozone equity markets could be in for pain if euro rally continues. Image: Gavekal, Macrobond
S&P 500 Options – S&P 500 3325-Strike Put Implied Volatility S&P 500 options reflect the possibility that the U.S. election results may be finalized with a delay. Image: Goldman Sachs Global Investment Research
Long-Only Fund Managers’ Aggregate Relative Weight in FANG Stocks This chart shows how crowed FANG stocks are. Image: BofA US Equity & Quant Strategy
Coronavirus Vaccine in the U.S. A vaccine for Covid-19 will accelerate the path to economic normalization. Image: Goldman Sachs Global Investment Research
U.S. Elections – Pre-election Equity Performance vs. Average Chart showing how the U.S. stock market has performed before and after presidential elections (“Closely contested” is defined as the margin of popular vote being below average).…