Asset Return Expections on a Five-Year Horizon
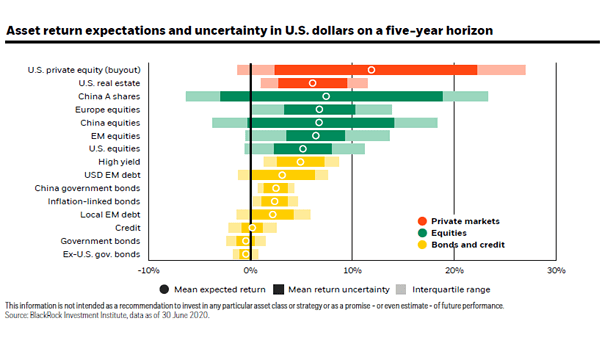
Asset Return Expections on a Five-Year Horizon Government bond returns are expected to be negative across developed markets on a five-year horizon. Source: BlackRock Investment Institute
Asset Return Expections on a Five-Year Horizon Government bond returns are expected to be negative across developed markets on a five-year horizon. Source: BlackRock Investment Institute
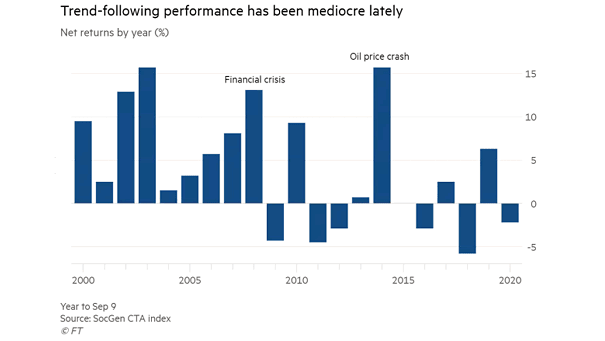
Trend-Following Performance Will trend-following strategies be able to deliver better performance in the future? Image: Financial Times
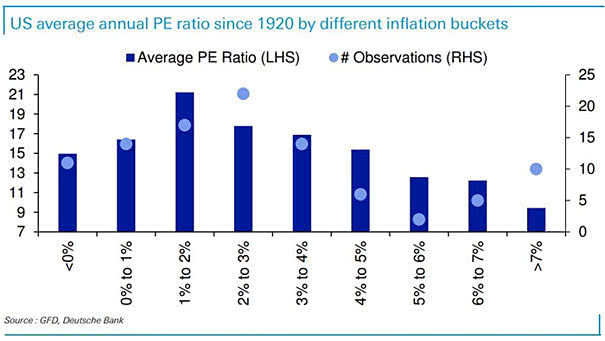
Different Inflation Buckets Chart suggesting how inflation affects the P/E ratio. Image: Deutsche Bank
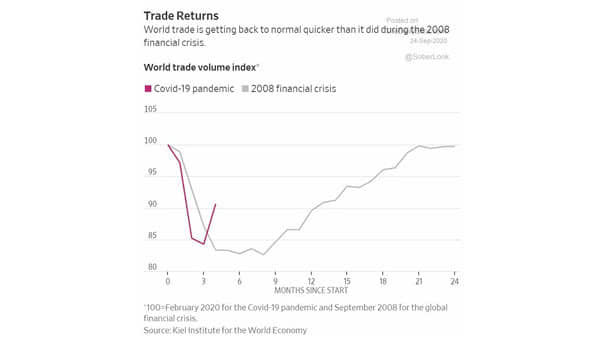
World Trade Volume Index World trade is rebounding faster than it did after the financial crisis of 2008. Image: The Wall Street Journal
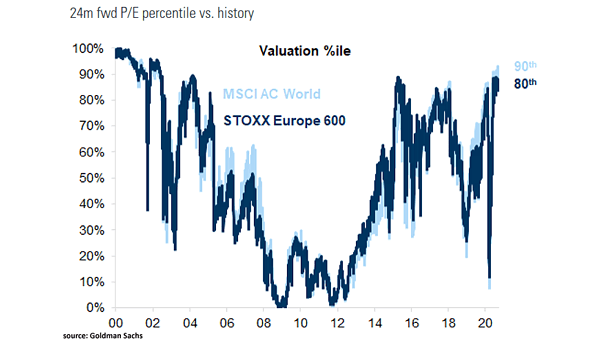
Valuation – MSCI ACWI and STOXX Europe 600 – 24-Month Forward P/E Percentile vs. History Should investors pay attention to stock valuation? Image: Goldman Sachs Global Investment Research
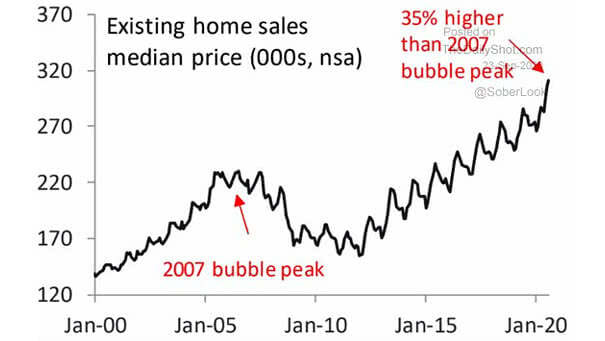
U.S. Housing – Existing Home Sales Median Price Existing home sales reached their highest level in 14 years, thanks to low rates. Image: Piper Sandler
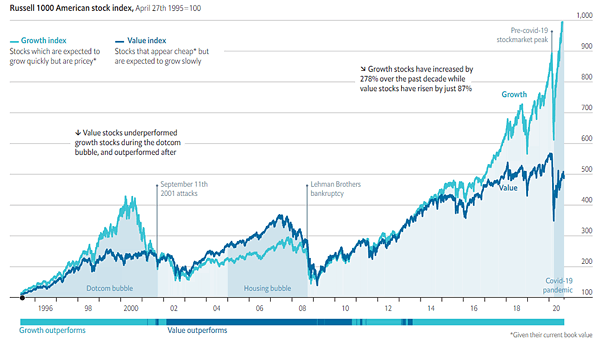
Russell 1000 American Stock Index – Growth vs. Value The gap between growth and value has widened considerably. It is now the largest divergence in decades. Image: The Economist
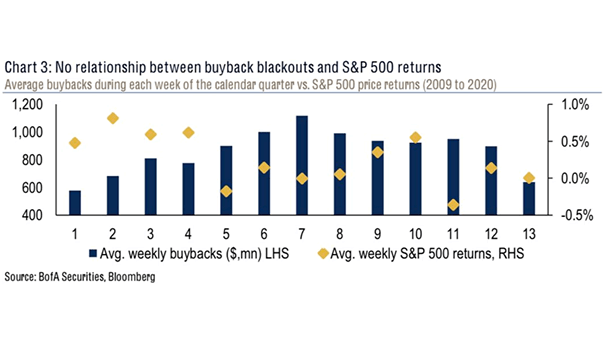
Buybacks and S&P 500 Returns Chart suggesting that there is no evidence that buybacks blackouts represent a risk to markets. Image: BofA Securities
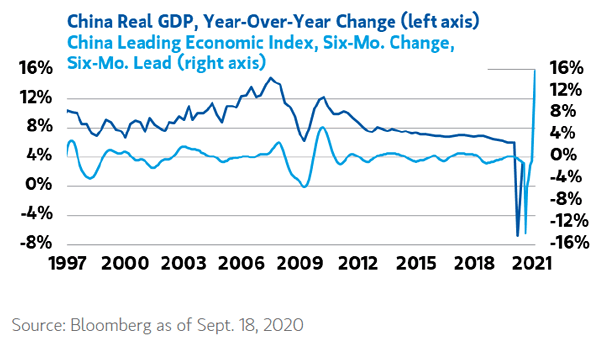
China Real GDP and China Leading Economic Index China appears to be on track for a V-shaped economic recovery. Image: Morgan Stanley Wealth Management
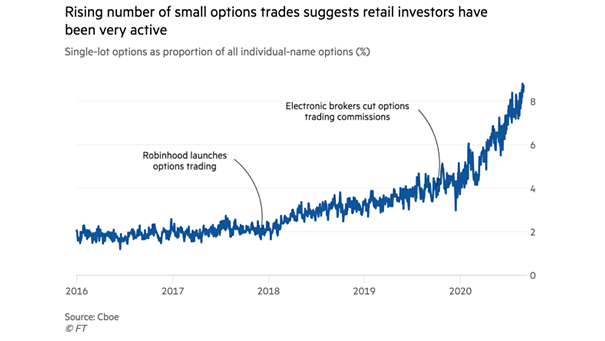
Retail Investors and Small Options Trades Does the boom in options trading by retail investors suggest a market meltdown? Image: Financial Times
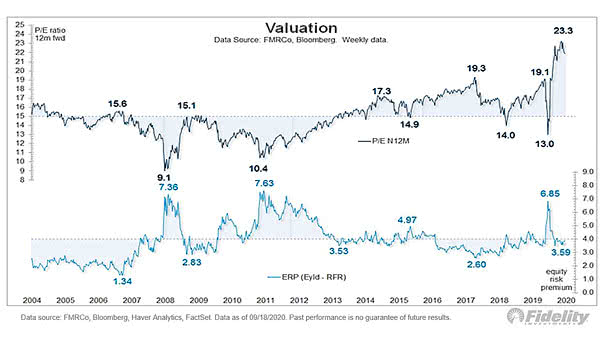
Valuation – 12-Month Forward P/E and Equity Risk Premium Despite the rise in the forward 12-month P/E ratio, the equity risk premium is in line with its long-term average. Image: Fidelity Investments