U.S. Elections – The U.S. Dollar Could Predict the Next President
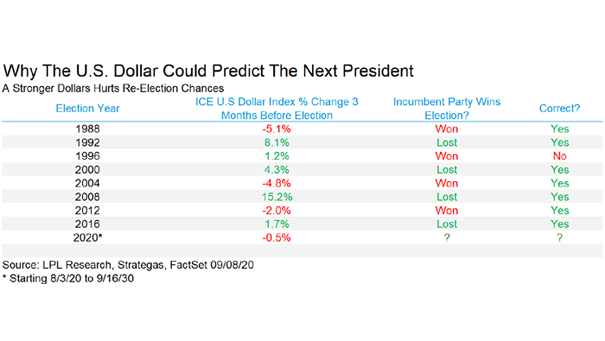
U.S. Elections – The U.S. Dollar Could Predict the Next President Historically, when the U.S. dollar has been weak, the incumbent party has tended to win. Image: LPL Research
U.S. Elections – The U.S. Dollar Could Predict the Next President Historically, when the U.S. dollar has been weak, the incumbent party has tended to win. Image: LPL Research
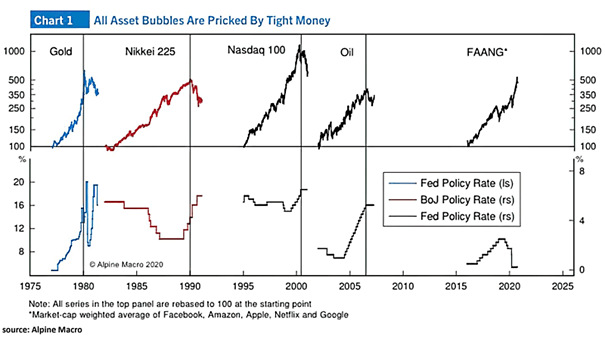
Asset Bubbles and Tight Money Should the Fed raise rates to prick the tech bubble? Image: Alpine Macro
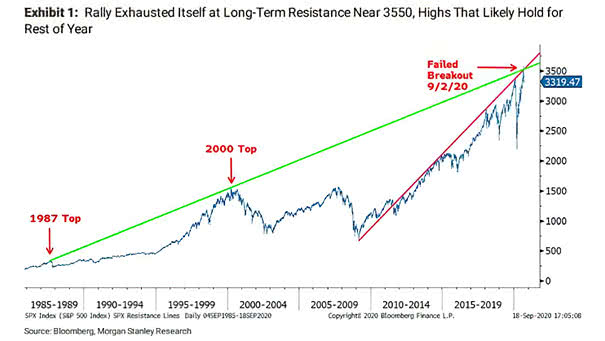
S&P 500 and Long-Term Resistance According to Morgan Stanley the correction isn’t over, as stocks get too extended. Image: Morgan Stanley Research
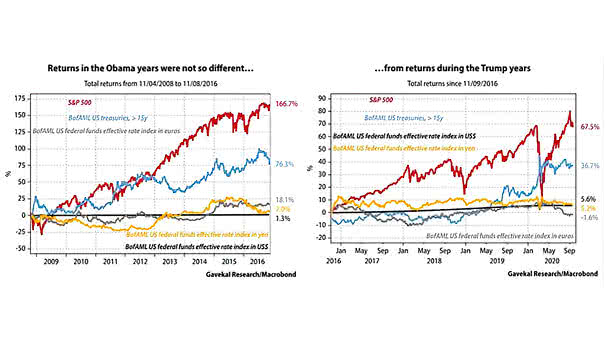
S&P 500 Returns – Obama vs. Trump Two charts comparing Obama’s vs. Trump’s stock market returns. Image: Gavekal, Macrobond
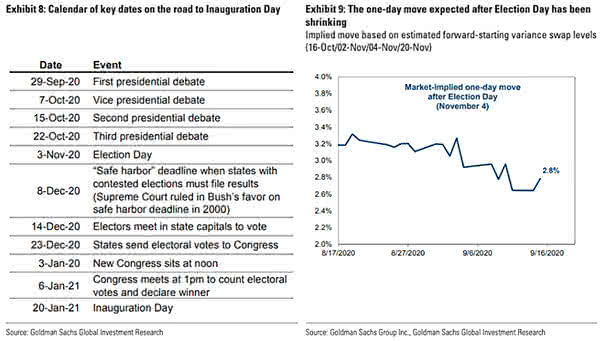
Market-Implied One-Day Move After U.S. Election Day The current expected move after Election Day is 2.8%, down from 3.2% in August. Image: Goldman Sachs Global Investment Research
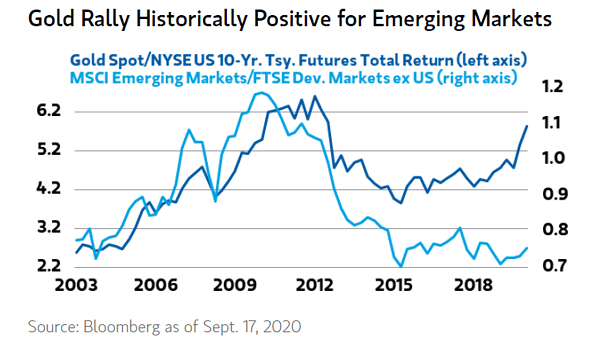
Gold and Emerging Markets The gold rally suggests that emerging markets could make a comeback. Image: Morgan Stanley Wealth Management
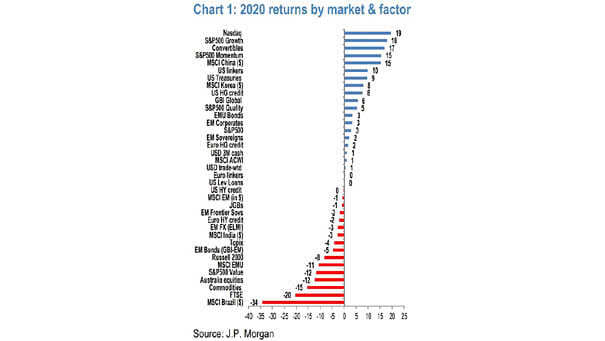
2020 Returns by Market and Factors Despite the recent pullback, the Nasdaq is up nearly 19% YTD. Image: J.P. Morgan
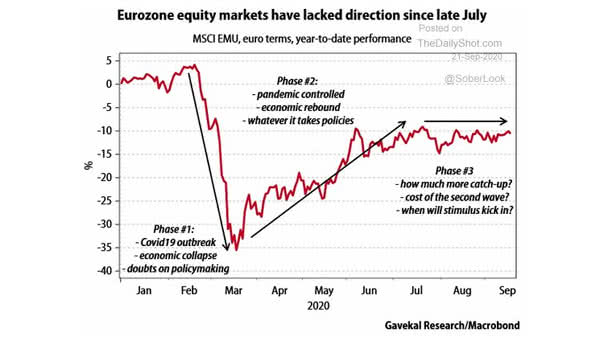
Eurozone Equity Markets Eurozone equity markets could be in for pain if euro rally continues. Image: Gavekal, Macrobond
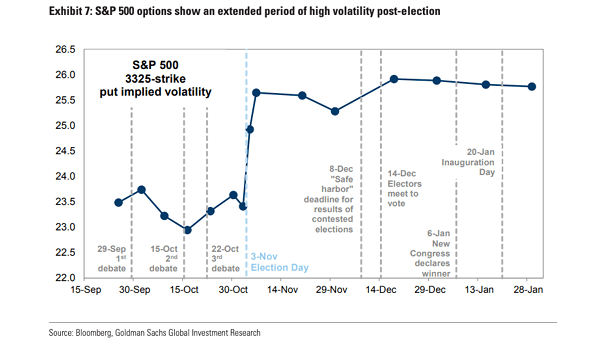
S&P 500 Options – S&P 500 3325-Strike Put Implied Volatility S&P 500 options reflect the possibility that the U.S. election results may be finalized with a delay. Image: Goldman Sachs Global Investment Research
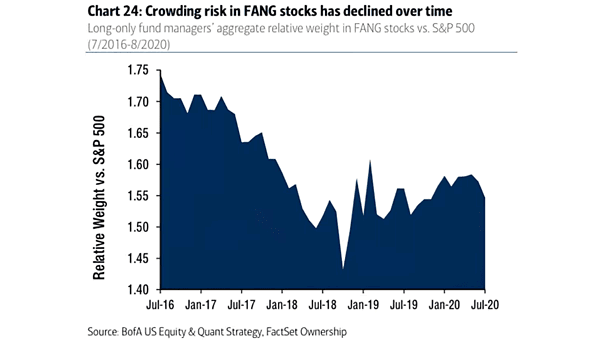
Long-Only Fund Managers’ Aggregate Relative Weight in FANG Stocks This chart shows how crowed FANG stocks are. Image: BofA US Equity & Quant Strategy
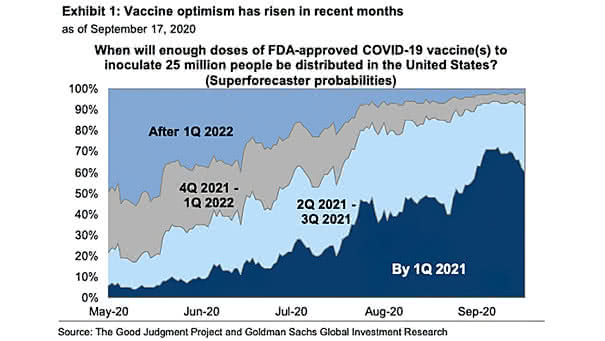
Coronavirus Vaccine in the U.S. A vaccine for Covid-19 will accelerate the path to economic normalization. Image: Goldman Sachs Global Investment Research