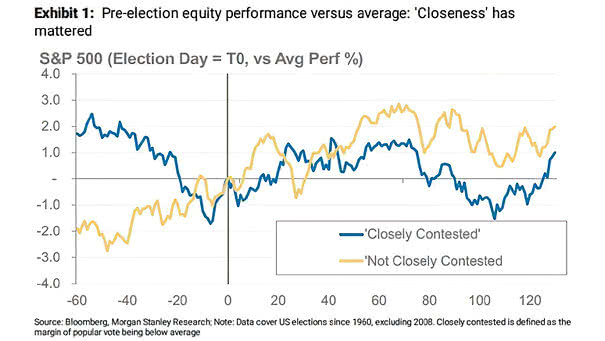
Nasdaq 100 vs. Nasdaq VIX

Nasdaq 100 vs. Nasdaq VIX The implied volatility of the Nasdaq 100 decreases during the market sell off. Are investors buying the dip? Image: The Daily Shot

U.S. Five-Year Inflation Swap and WTI Oil

U.S. Five-Year Inflation Swap and WTI Oil Chart suggesting the correlation between inflation expectations and oil prices. Image: Morgan Stanley Wealth Management

Coronavirus Vaccine in the United States

Coronavirus Vaccine in the United States Will a coronavirus vaccine be approved by the FDA between October 2020 and March 2021? Image: Goldman Sachs Global Investment Research

U.S. Option Positioning Indicators

U.S. Option Positioning Indicators Should investors be concerned about the increase in option positioning indicators? Image: Goldman Sachs Global Investment Research

Global Real GDP Forecasts

Global Real GDP Forecasts Chart suggesting that the V-shaped recovery is proceeding faster than the previous forecast. Image: Morgan Stanley Research