S&P 500 Bear Markets
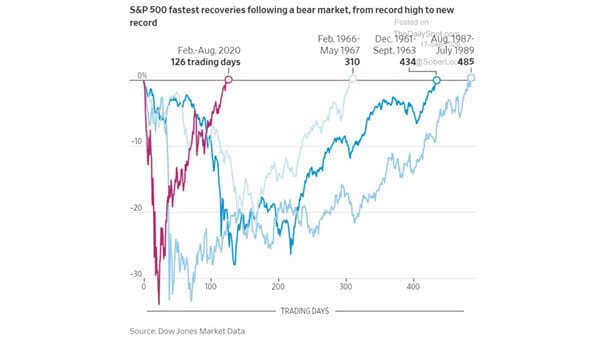
S&P 500 Bear Markets It was the fastest bear market and the fastest recovery in history. Image: The Wall Street Journal
S&P 500 Bear Markets It was the fastest bear market and the fastest recovery in history. Image: The Wall Street Journal
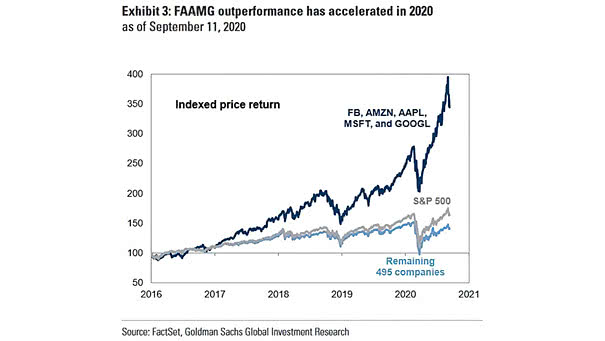
FAAMG Stocks vs. S&P 500 FAAMG stocks have rocketed this year: 40% YTD vs. 5% for the S&P 500. Image: Goldman Sachs Global Investment Research
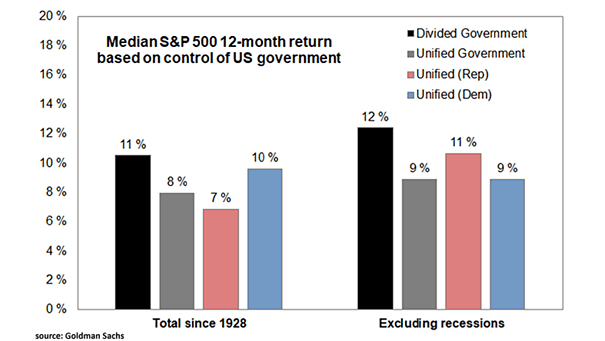
U.S. Elections – Median S&P 500 12-Month Return Based on Control of U.S. Government As the chart suggests, a divided government is best for the U.S. stock market. Image: Goldman Sachs
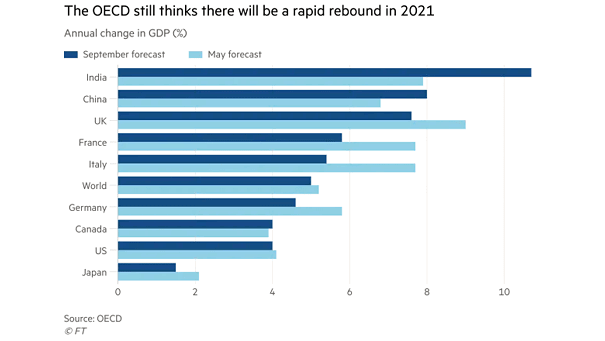
OECD Forecasts – Annual Change in GDP The coronavirus pandemic has plunged the global economy into the worst recession since World War II, but the OECD expects a rapid rebound next year. Image: Financial Times
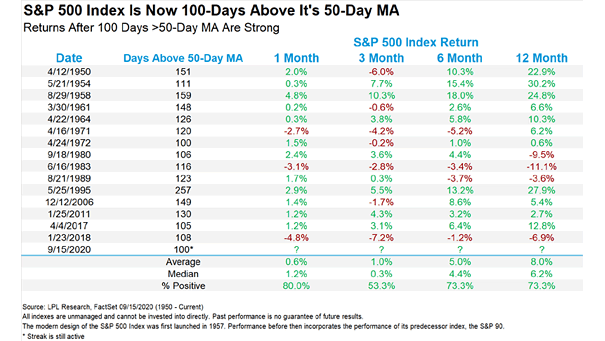
S&P 500 Returns After 100 Days > 50-Day Moving Average When the S&P 500 is 100-days above its 50-day moving average, as it is today, it tends to be bullish over the next 12 months.…
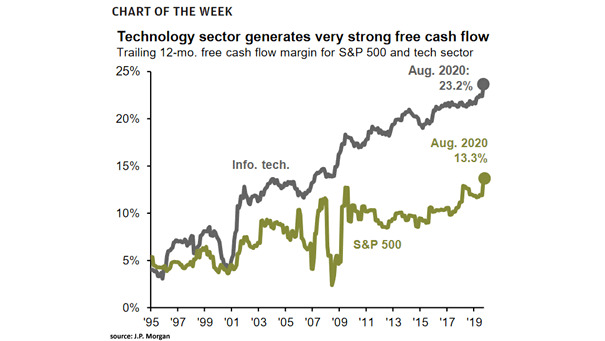
Free Cash Flow Margin for S&P 500 and Tech Sector The free cash flow margin for the tech sector has risen from less than 5% in the aftermath of the Internet bubble to more than…
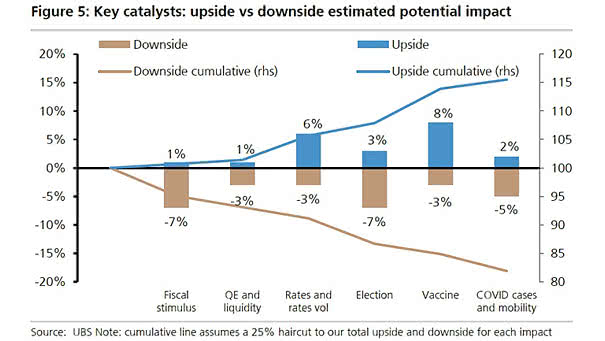
Upside vs. Downside Estimated Potential Impact for U.S. Equities This chart suggests the potential impacts of catalysts for U.S. equities. Image: UBS
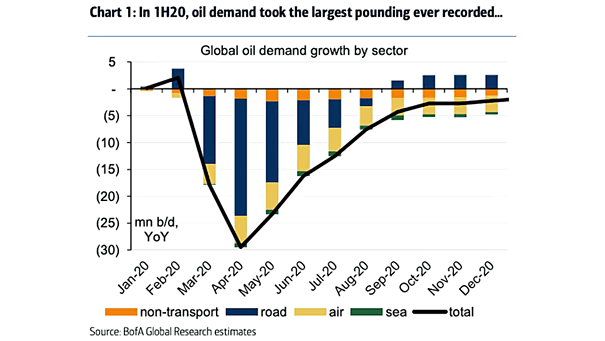
Global Oil Demand Growth by Sector Global oil demand is recovering sequentially as the world’s coronavirus lockdowns are being eased. Image: BofA Global Research
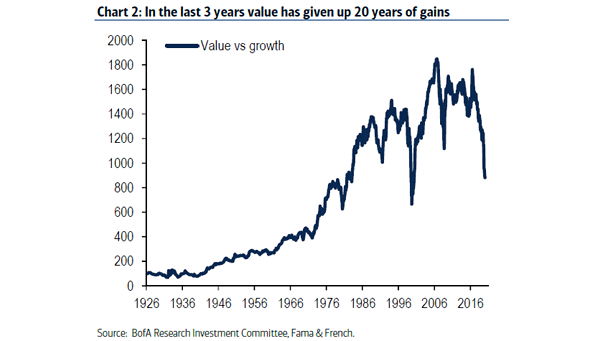
Value vs. Growth Will value stocks outperform growth stocks as the economy rebounds? Image: BofA Research Investment Committee
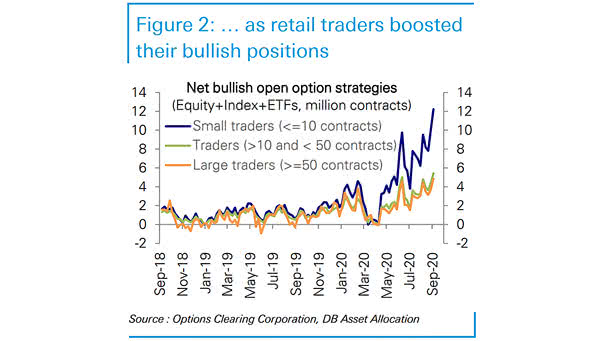
Net Bullish Open Option Strategies This chart highlights the surge in options trading by retail traders. Image: Deutsche Bank Asset Allocation
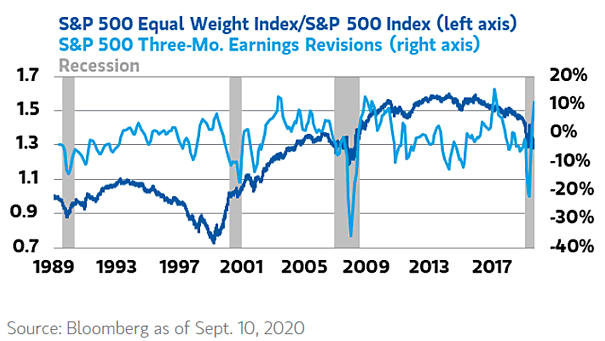
S&P 500 Equal Weight Index/S&P 500 Index vs. S&P 500 Three-Month Earnings Revisions The current gap between the equal- and cap-weighted indexes has usually ended with the underperformance of mega-cap stocks. Image: Morgan Stanley Weath…