Bubble – Wilshire 5000 to Nominal GDP Ratio
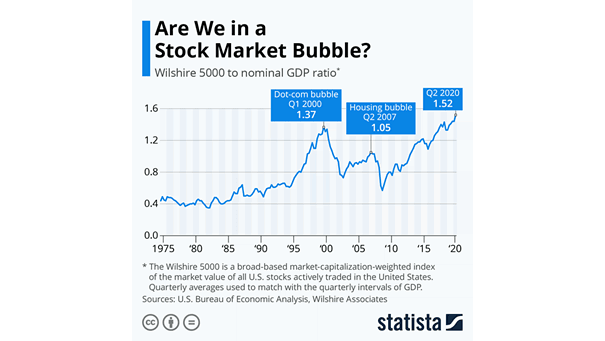
Bubble – Wilshire 5000 to Nominal GDP Ratio The ratio of market capitalization to GDP is now higher than it was before the Internet bubble burst. Is the U.S. stock market on a bubble? Image:…
Bubble – Wilshire 5000 to Nominal GDP Ratio The ratio of market capitalization to GDP is now higher than it was before the Internet bubble burst. Is the U.S. stock market on a bubble? Image:…
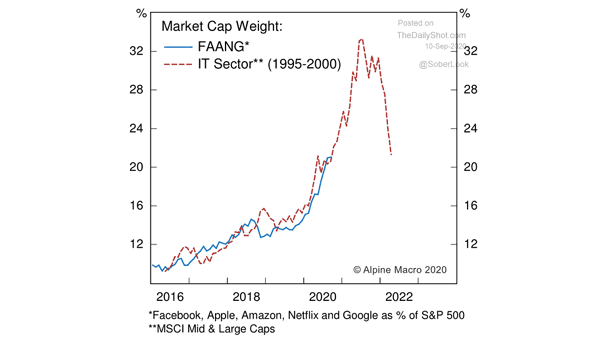
Market Capitalization Weight – FAANG Stocks vs. IT Sector (1995-2000) Are investors facing another tech bubble? Image: Alpine Macro
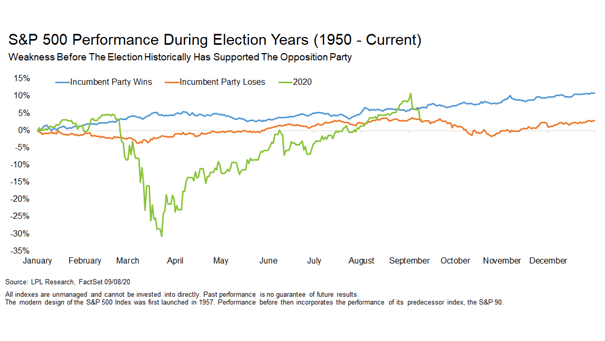
S&P 500 Performance During U.S. Election Years Since 1950 The S&P 500 could start to weaken now, if President Donald Trump is going to lose the 2020 election. Image: LPL Research
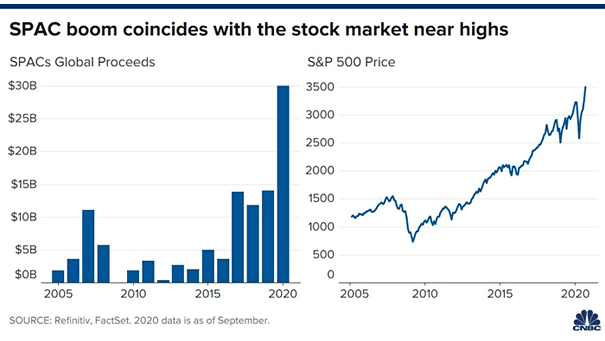
SPACs Global Proceeds and S&P 500 Price SPACs (Special Purpose Acquisition Companies) are booming and have coincided with the equity market near highs, according to Citi. Image: CNBC
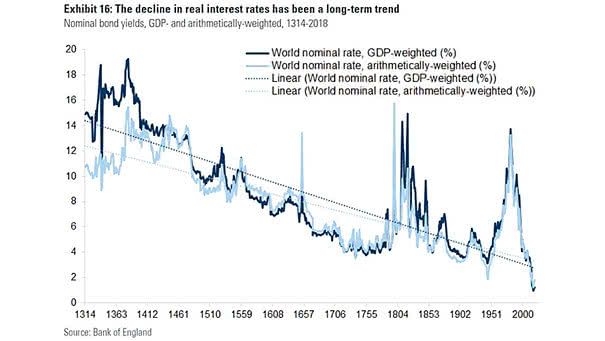
Real Interest Rates Since 1314 Since 1314, real interest rates have been on a long-term downward trend. Image: Goldman Sachs Global Investment Research
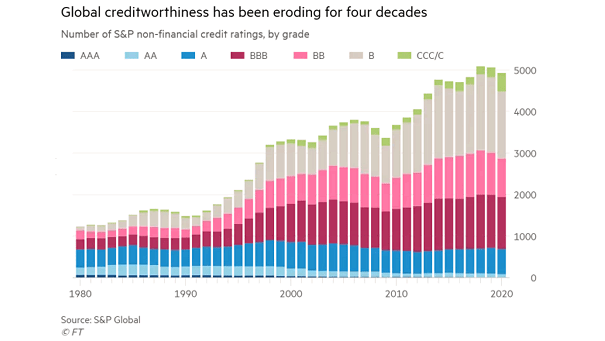
Number of S&P Non-Financial Credit Ratings Global creditworthiness fades as companies embrace debt. Triple-A ratings are a thing of the past. Image: Financial Times
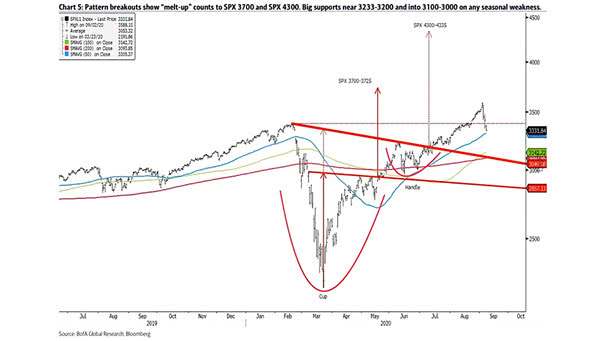
S&P 500 and Pattern Breakouts The chart projection on the S&P 500 suggests 4300, given the summer’s breakout from a bullish cup-and-handle. Image: BofA Global Research
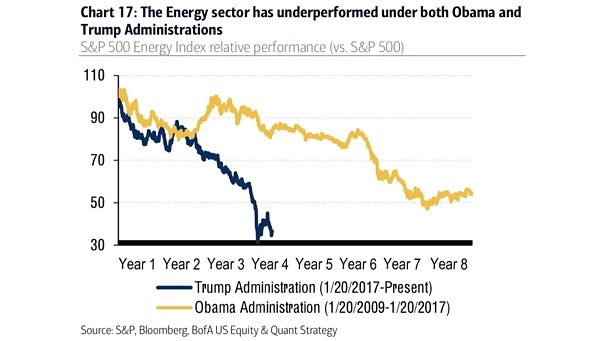
S&P 500 Energy Index Relative Performance (vs. S&P 500) The energy sector has been the worst performing sector in the S&P 500 over the past decade. Image: BofA US Equity & Quant Strategy
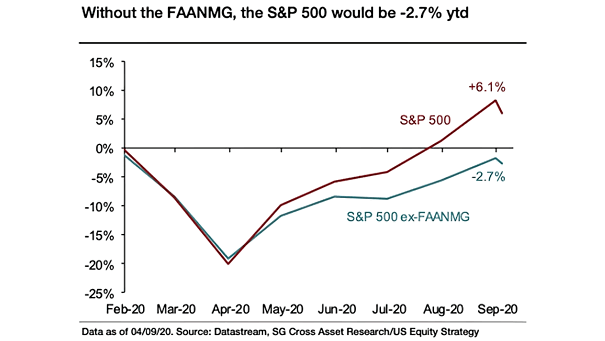
Returns – S&P 500 vs. S&P ex-FAANMG FAANMG stocks are driving the S&P 500 higher year-to-date. Image: Societe Generale Cross Asset Research
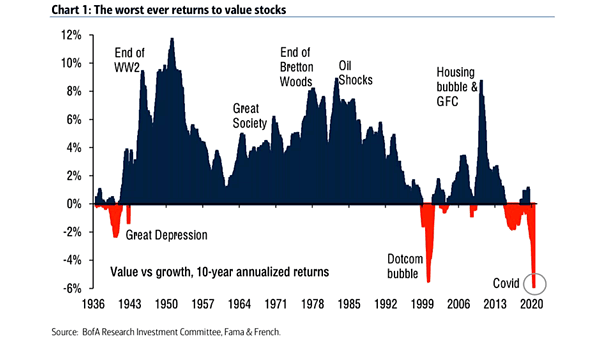
Value vs. Growth Stocks – 10-Year Annualized Returns The worst ever returns to value stocks. Will value stocks outperform growth stocks in the recovery phase? Image: BofA Research Investment Committee
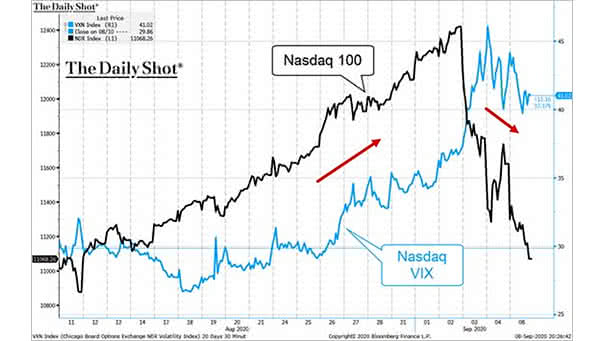
Nasdaq 100 vs. Nasdaq VIX The implied volatility of the Nasdaq 100 decreases during the market sell off. Are investors buying the dip? Image: The Daily Shot