GWIM Macro Sentiment Barometer with Historical Events
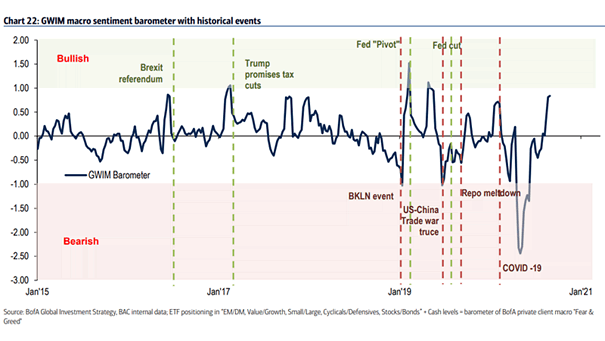
GWIM Macro Sentiment Barometer with Historical Events The GWIM macro sentiment barometer is still moving towards bullish. Image: BofA Global Investment Strategy
GWIM Macro Sentiment Barometer with Historical Events The GWIM macro sentiment barometer is still moving towards bullish. Image: BofA Global Investment Strategy
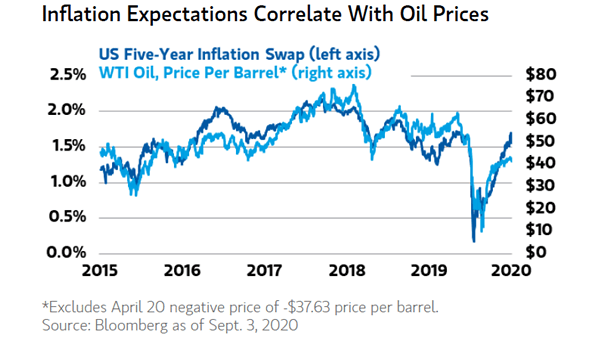
U.S. Five-Year Inflation Swap and WTI Oil Chart suggesting the correlation between inflation expectations and oil prices. Image: Morgan Stanley Wealth Management
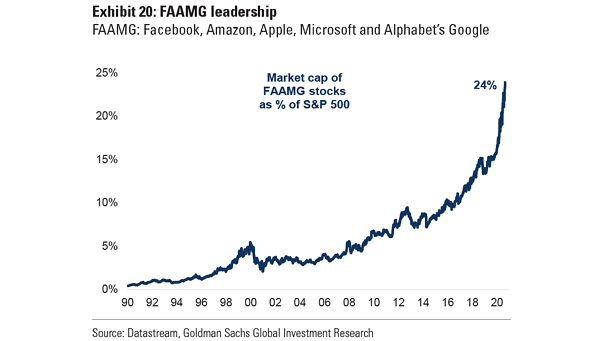
Market Capitalization of FAAMG Stocks as % of S&P 500 This chart highlights the record concentration of market cap in FAAMG stocks. Image: Goldman Sachs Global Investment Research
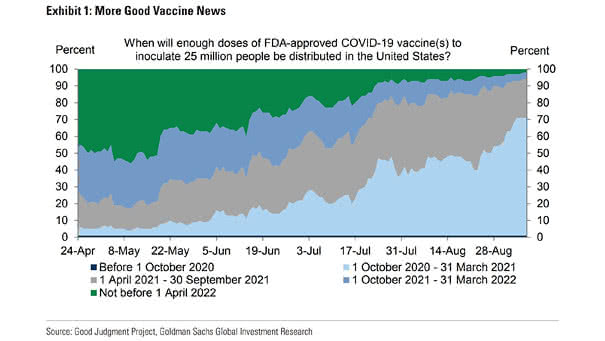
Coronavirus Vaccine in the United States Will a coronavirus vaccine be approved by the FDA between October 2020 and March 2021? Image: Goldman Sachs Global Investment Research
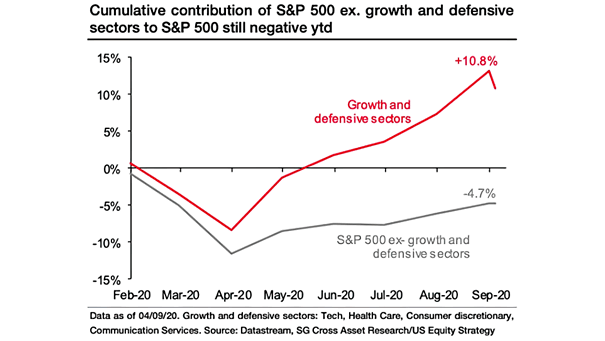
Returns – Growth and Defensive Sectors vs. S&P 500 ex-Growth and Defensive Sectors Growth and defensive sectors are driving the S&P 500 higher YTD. Image: Societe Generale Cross Asset Research
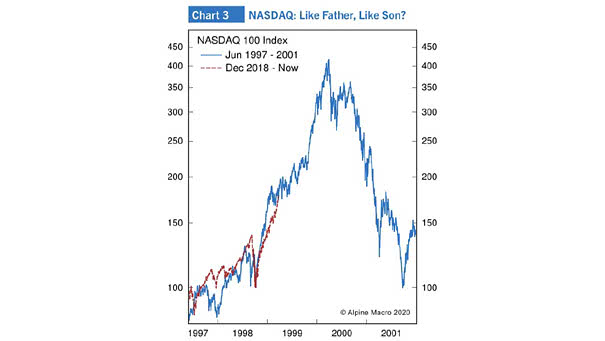
Nasdaq 100 Index: Today vs. 1997-2001 Are investors facing another tech bubble? Image: Alpine Macro
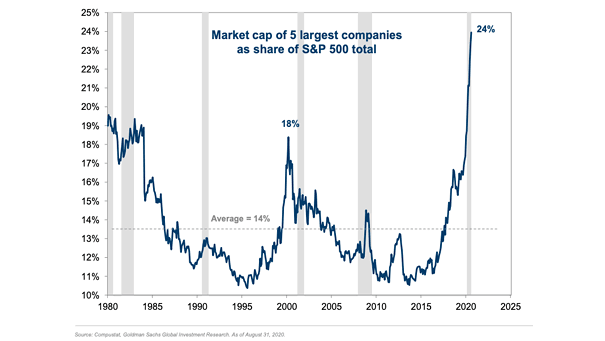
Market Capitalization – Five Largest Companies as Share of S&P 500 Total This chart highlights the record concentration of market cap in the five largest stocks. Image: Goldman Sachs Global Investment Research
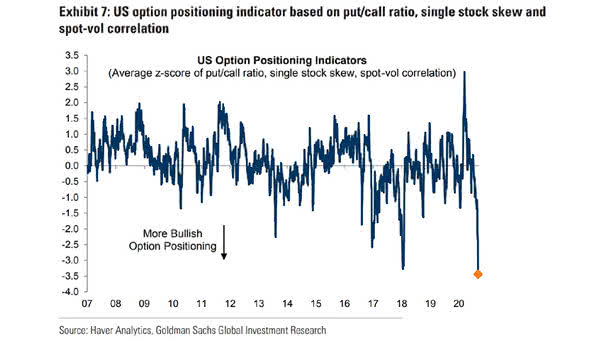
U.S. Option Positioning Indicators Should investors be concerned about the increase in option positioning indicators? Image: Goldman Sachs Global Investment Research
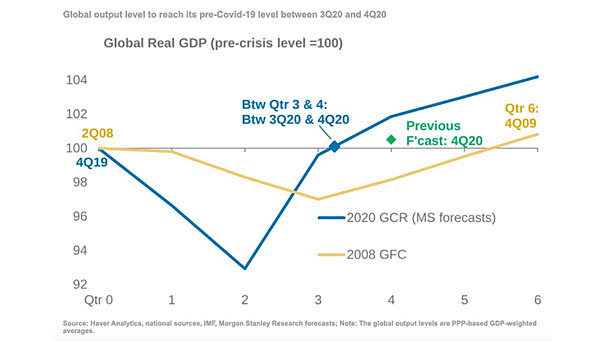
Global Real GDP Forecasts Chart suggesting that the V-shaped recovery is proceeding faster than the previous forecast. Image: Morgan Stanley Research
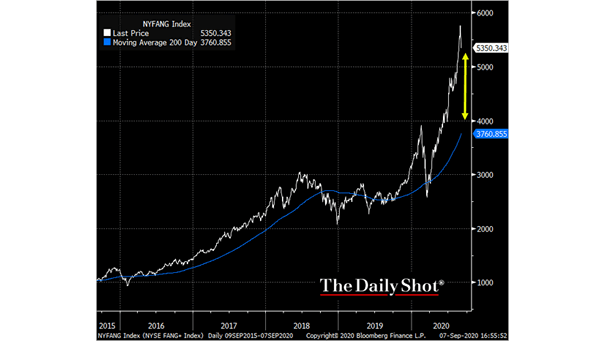
FANG Stocks and 200-Day Moving Average How high above the 200-day moving average can FANG stocks get? Should investors be concerned? Image: The Daily Shot
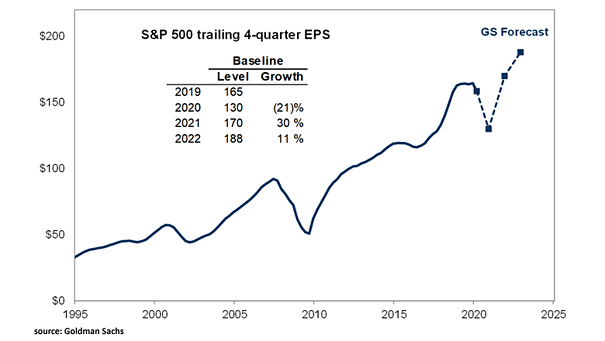
S&P 500 Trailing 4-Quarter EPS Goldman Sachs expects S&P 500 earnings to contract by 21% in 2020, before rebounding by 30% next year and 11% in 2022. Image: Goldman Sachs Global Investment Research