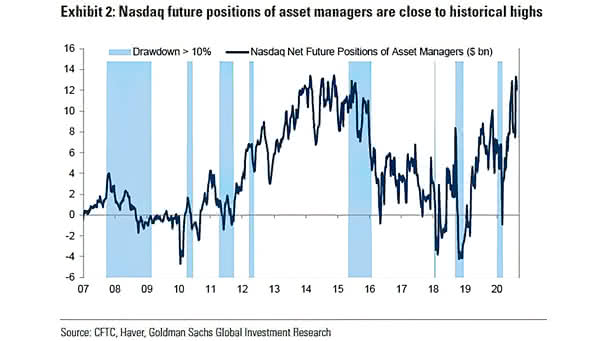
S&P 500 Value Index vs. S&P 500 Index
S&P 500 Value Index vs. S&P 500 Index As investors continue to pile into growth stocks, is value investing dead? Image: Bloomberg
Volatility and U.S. Elections This chart shows how U.S. presidential elections affect volatility when the same party remains in office or not. Image: Goldman Sachs Global Investment Research
Conference Board Consumer Confidence U.S. consumer confidence falls in August, as more and more companies announce layoffs. Image: The Daily Shot
Japan and Global Equity Markets With a soft domestic economy, Japan’s equity market has lagged global equities. Image: Gavekal, Macrobond
S&P 500 Total Return / S&P 500 Equally Weighted Total Return Will the S&P 500 continue to outperform its equally weighted equivalent? Image: Deutsche Bank
Quarterly GDP Trajectory, Base Case – U.S., Euro Area and China This chart suggests the base case scenario for 2020/2021 GDP growth. Image: BofA Global Research
Equal-Weighted S&P 500 and S&P 500 Cumulative Advance/Decline Charts suggesting that a market correction may begin soon, as the S&P 500 cumulative advance/decline line fails to confirm the new all-time highs. Image: Morgan Stanley Research
Cumulative YTD Flows in Large vs. Small Cap Stocks BofA’s clients sell large cap stocks and buy small caps, amid new market highs. Image: BofA Securities
Market Capitalization – Top 5 Stocks as a Share of the Total Index The market capitalization of the five largest companies now accounts for 37% of the Russell 1000 Growth Index. Image: Goldman Sachs Global…
Performance – Return from the S&P 500’s Prior High on Feb. 19 to the New All-Time High Despite the S&P 500 new all-time high, a majority of S&P 500 stocks are down significantly from where…
Dividends – Annual S&P 500 DPS Growth Goldman Sachs expects that the pace of dividend cuts will moderate. Image: Goldman Sachs Global Investment Research