S&P 500 2020 Target Models
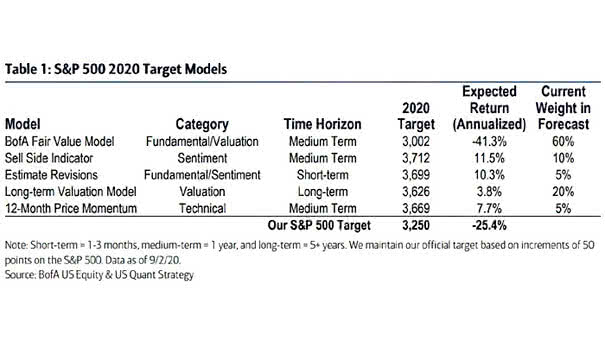
S&P 500 2020 Target Models BofA has raised its S&P 500 price target for 2020 from 2,900 to 3,250, but still below current market levels. Image: BofA US Equity & US Quant Strategy
S&P 500 2020 Target Models BofA has raised its S&P 500 price target for 2020 from 2,900 to 3,250, but still below current market levels. Image: BofA US Equity & US Quant Strategy
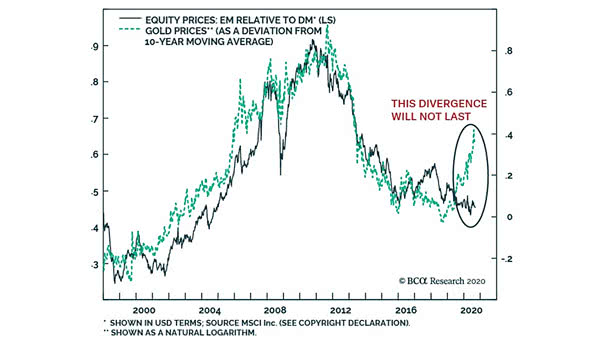
Equity Prices – EM Relative to DM vs. Gold Prices Is the relative performance of emerging market equities vs. developed market equities at a major market turning point? Image: BCA Research
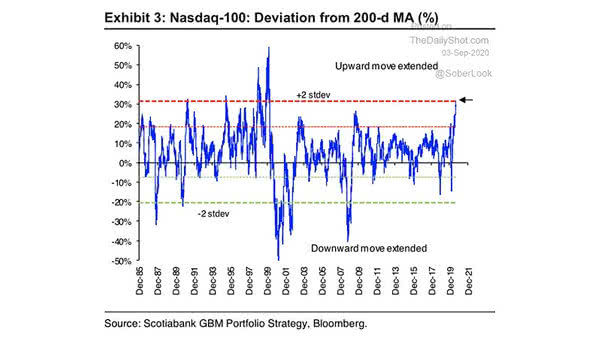
Nasdaq 100 Deviation from 200-Day Moving Average The risk of a reversion grows, as the Nasdaq 100 trades 2-standard deviations above the 200 DMA. Image: Scotiabank GBM Portfolio Strategy
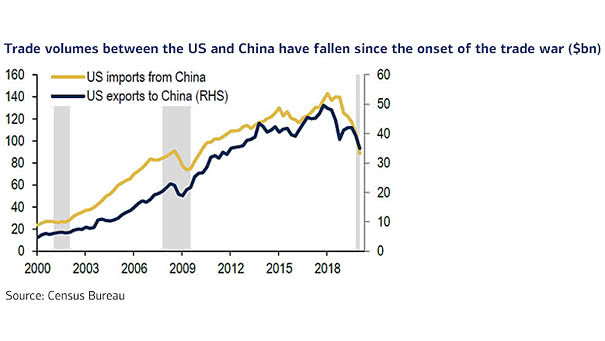
Trade Volumes – U.S. Imports from China and U.S. Exports to China The effects of the coronavirus pandemic have also negatively impacted trade volumes between the U.S. and China. Image: BofA
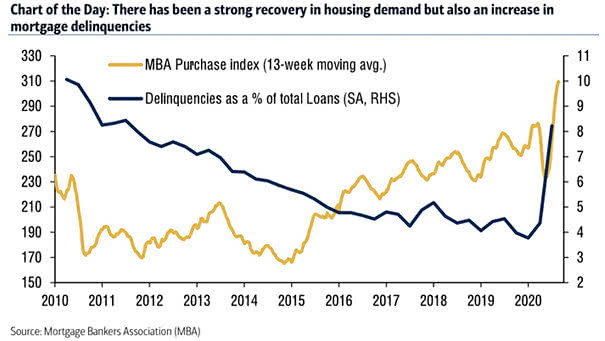
U.S. Housing Demand and Mortgage Delinquencies A strong recovery in housing demand, but an increase in mortgage delinquencies. The wealth gap is widening in the United States. Image: BofA
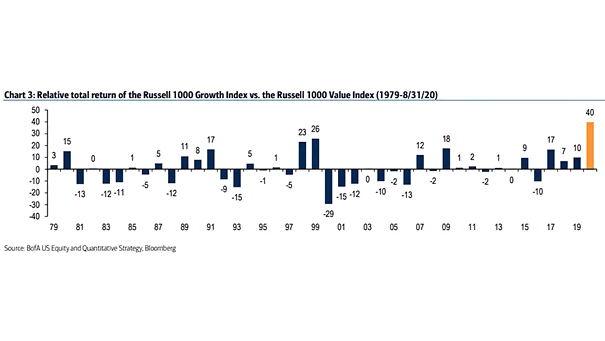
Relative Total Return of the Russell 1000 Growth Index vs. the Russell 1000 Value Index Will the Russell 1000 Growth Index continue to significantly outperform the Russell 1000 Value Index? Image: BofA US Equity and…
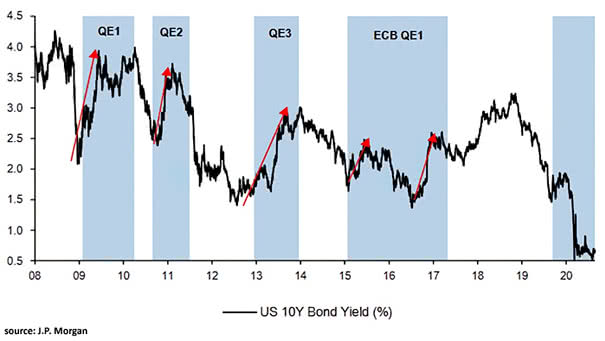
Quantitative Easing (QE) and Bond Yields Bond yields tend to move higher after QE starts. So far, however, QE seems to have a different effect on the bond market. Image: J.P. Morgan

S&P 500 Index vs. Retail Favorites Index Retail investor stock picks are beating the S&P 500 Index YTD. But are retail investors ready for a market crash? Image: The Daily Shot
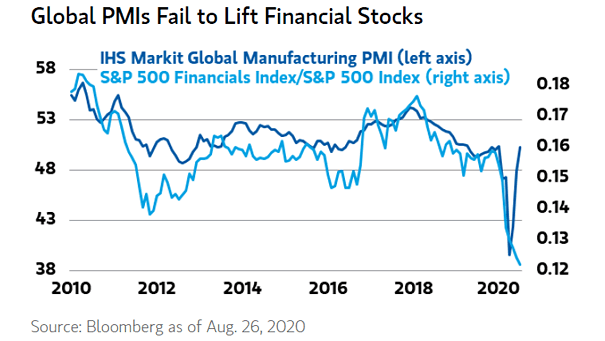
Global Manufacturing PMI vs. S&P 500 Financials Index/S&P 500 Index Financials are generally highly correlated with the rebound in economic indices, but they are lagging. Image: Morgan Stanley Wealth Management
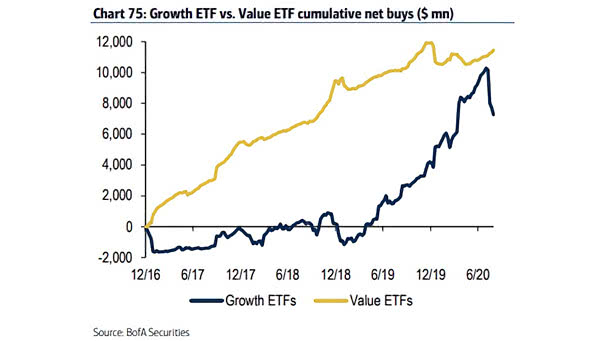
Growth ETF vs. Value ETF Flows This chart puts into perspective Growth ETF vs. Value ETF flows. Image: BofA Securities
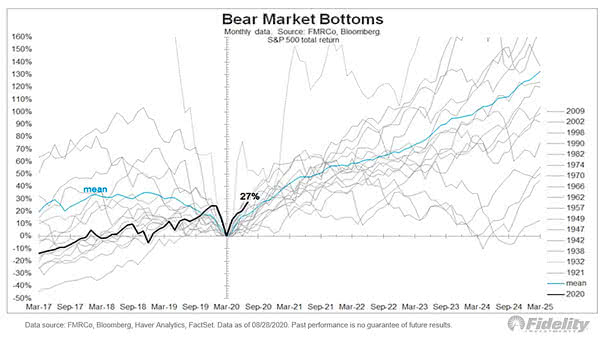
S&P 500 Total Return – Bear Market Bottoms This chart shows bear markets over the past 100 years. Is a new bull market cycle underway? Image: Fidelity Investments