VIX vs. S&P 500
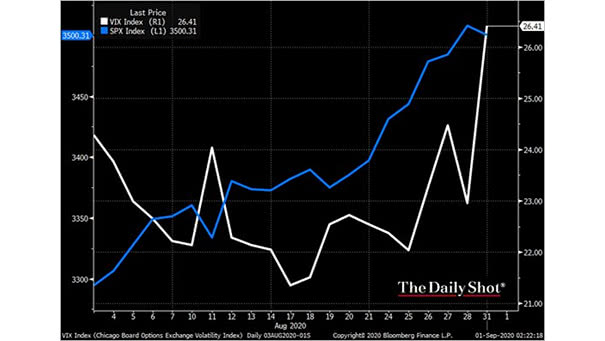
VIX vs. S&P 500 The VIX and the S&P 500 tend to move in opposite directions. As the VIX is raising, it is a warning signal for the recent market rally. Image: The Daily Shot
VIX vs. S&P 500 The VIX and the S&P 500 tend to move in opposite directions. As the VIX is raising, it is a warning signal for the recent market rally. Image: The Daily Shot
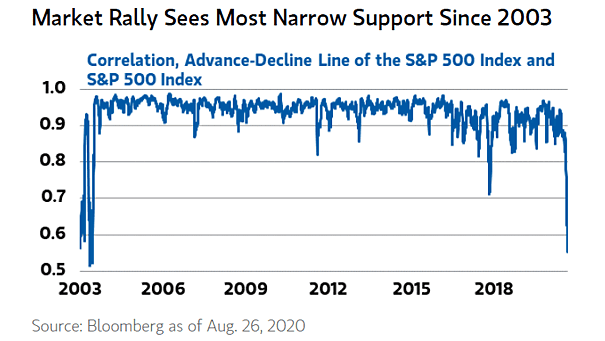
Correlation, Advance/Decline Line of the S&P 500 and S&P 500 Index The advance/decline line of the S&P 500 Index has steadily deteriorated during the recent market rally. Image: Morgan Stanley Wealth Management
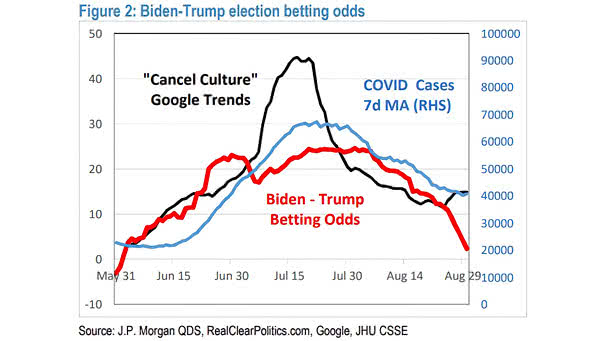
Biden-Trump Election Betting Odds As odds are rising, is Donald Trump on course to repeat 2016 win? Image: J.P. Morgan
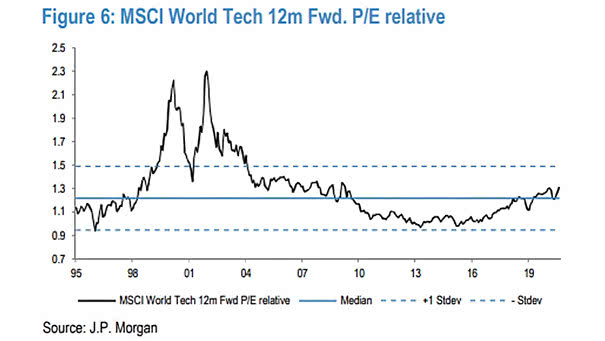
Valuation – MSCI World Tech 12M Fwd P/E Relative Chart suggesting that MSCI World Tech relative P/E doesn’t appear expensive. Image: J.P. Morgan
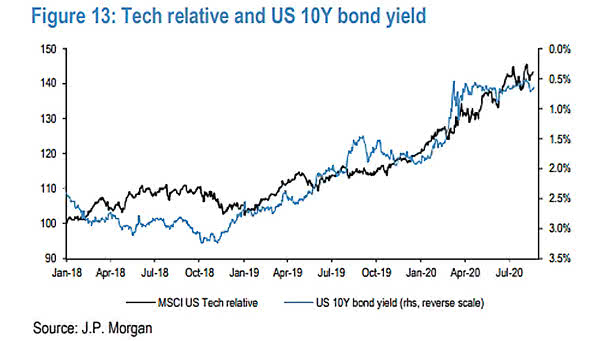
Correlation – MSCI U.S. Tech Relative vs. U.S. 10-Year Bond Yield This chart suggests the good correlation between tech relative and U.S. 10-year bond yields (inverted). Image: J.P. Morgan
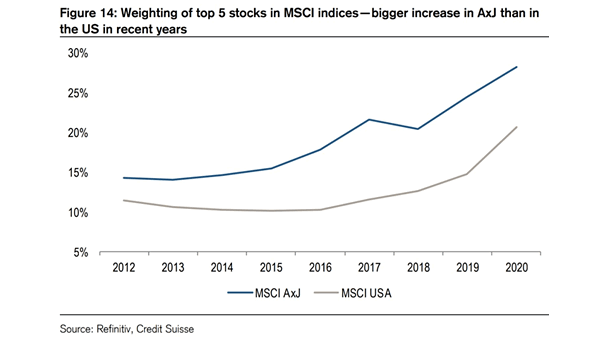
Top 5 Stocks – MSCI Asia ex Japan Index vs. MSCI USA Index The MSCI Asia ex Japan Index is more concentrated in the 5 largest stocks than the MSCI USA Index. Image: Credit Suisse
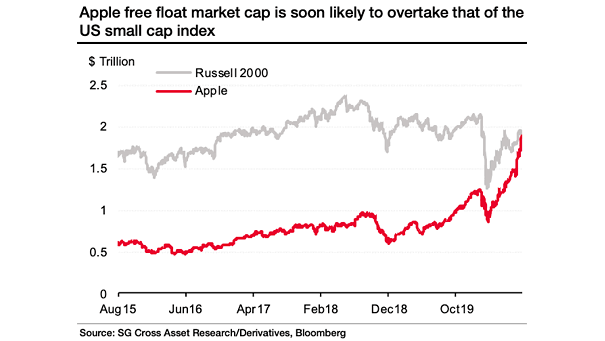
Apple Market Capitalization vs. Russell 2000 This charts shows how big Apple is compared to U.S. small cap stocks. Image: Societe Generale Cross Asset Research
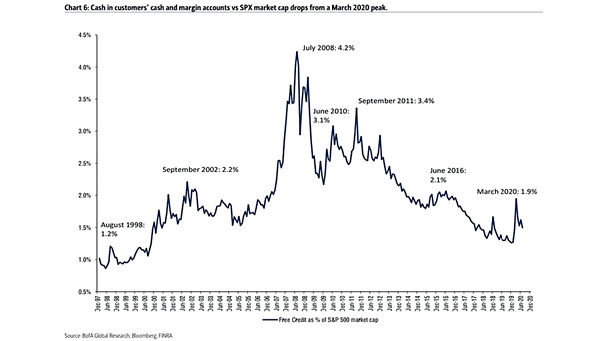
Cash in Customers’ Cash and Margin Accounts vs. S&P 500 Market Capitalization Free credit (cash) in customer accounts as % of S&P 500 market cap has moved lower, offering further bullish confirmation for the S&P…
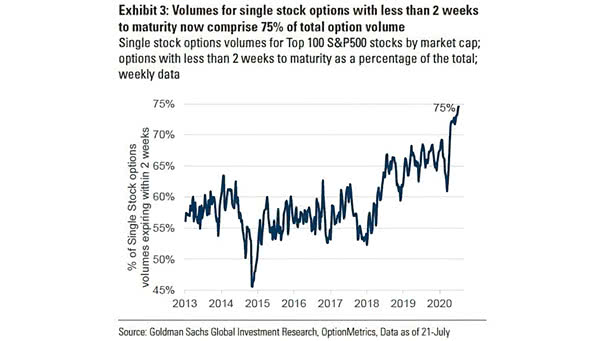
Investors and Trading Activity in Options Investors are trading more actively in options with less than 2 weeks to maturity, driven by better visibility of the catalyst path. Image: Goldman Sachs Global Investment Research
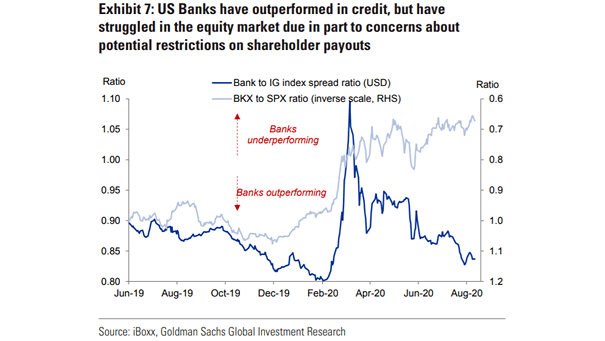
Bank to IG Index Spread Ratio and Bank to S&P 500 Ratio Are U.S. bank stocks a buying opportunity, despite Warren Buffett’s selloff? Image: Goldman Sachs Global Investment Research
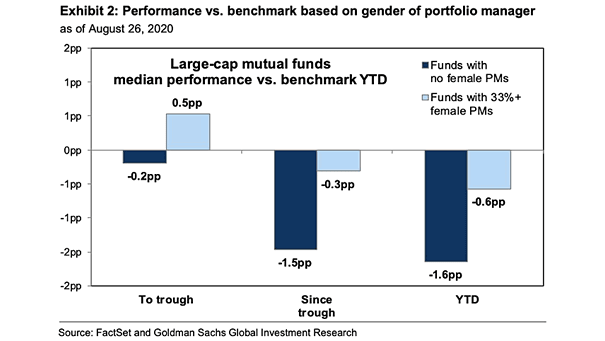
Performance vs. Benchmark Based on Gender of Portfolio Manager This year, women fund managers are beating their male counterparts in picking stocks. Image: Goldman Sachs Global Investment Research