Yield Curve and U.S. Real GDP Growth – Broad-Based Recovery in 2021
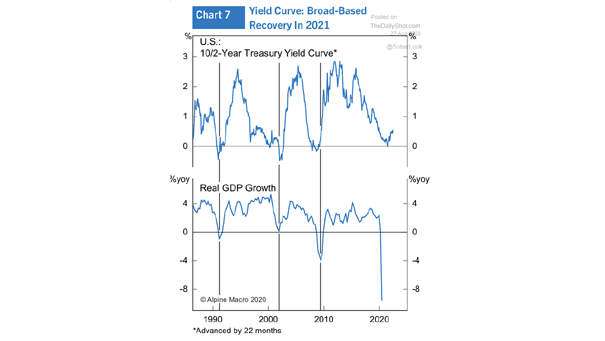
Yield Curve and U.S. Real GDP Growth – Broad-Based Recovery in 2021 The current steepening of the yield curve suggests a long road to recovery Image: Alpine Macro
Yield Curve and U.S. Real GDP Growth – Broad-Based Recovery in 2021 The current steepening of the yield curve suggests a long road to recovery Image: Alpine Macro
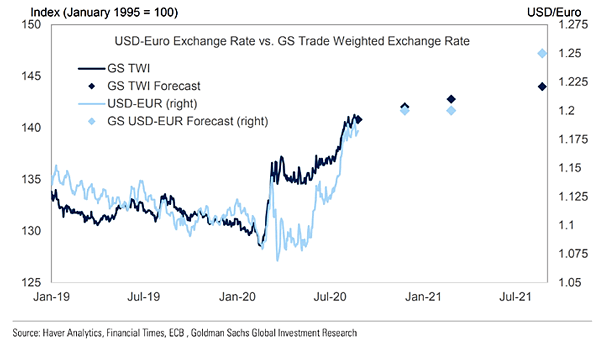
U.S. Dollar-Euro Exchange Rate Forecast According to Goldman Sachs, the U.S. dollar offers poor fundamentals and remains overvalued despite the recent selloff. Image: Goldman Sachs Global Investment Research
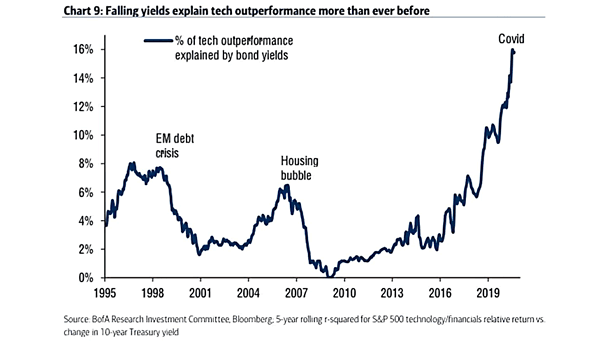
% of Tech Outperformance Explained by Bond Yields Chart suggesting that falling bond yields lead to tech outperformance more than ever. Image: BofA Research Investment Committee
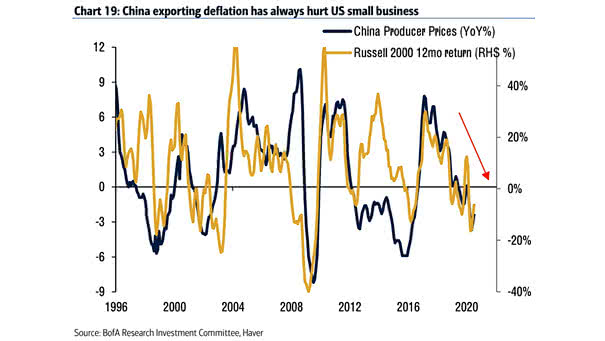
U.S. Small Cap Stocks – China Producer Prices vs. Russell 2000 12-Month Return Chart suggesting the impact of China producer prices on U.S. small cap stocks. Image: BofA Research Investment Committee
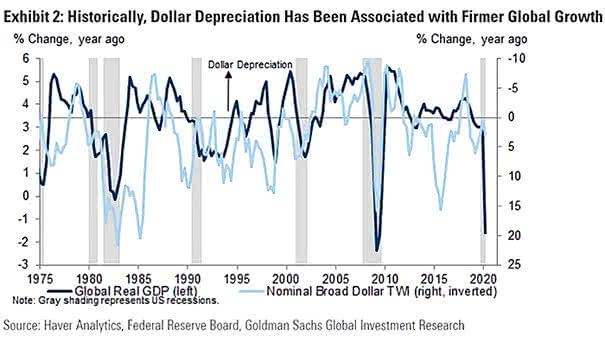
Global Real GDP vs. Nominal Broad Dollar TWI The U.S. dollar tends to weaken when global growth picks up. Image: Goldman Sachs Global Investment Research
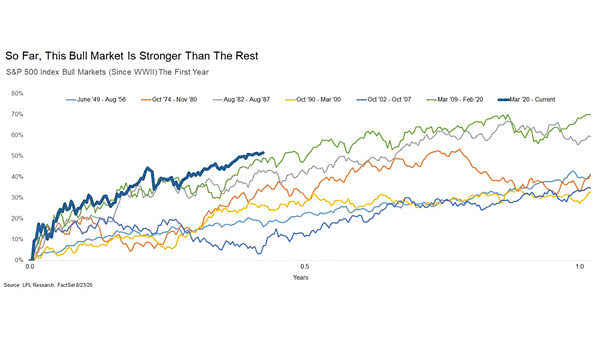
S&P 500 Index Bull Markets (Since WWII) the First Year So far, the new bull maket is topping all other bull markets since WWII. Image: LPL Research
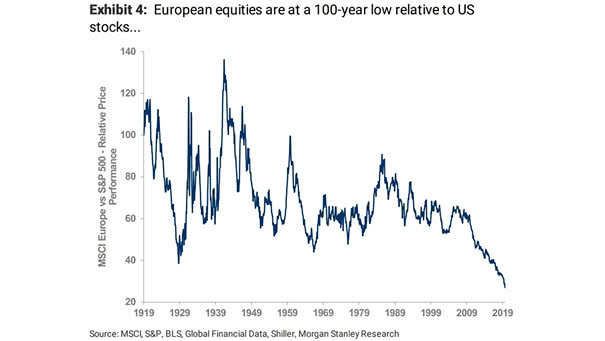
Performance – European Equities vs. U.S. Stocks Should investors look at U.S. stocks or European equities? Image: Morgan Stanley Research
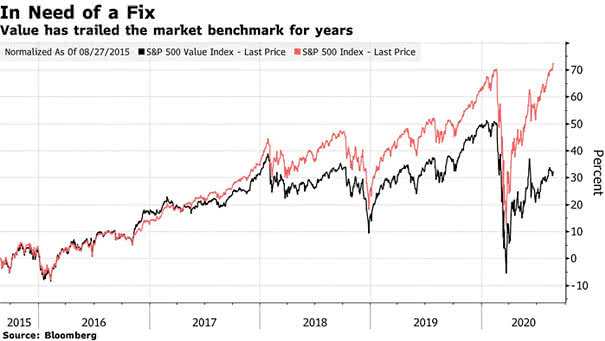
S&P 500 Value Index vs. S&P 500 Index As investors continue to pile into growth stocks, is value investing dead? Image: Bloomberg
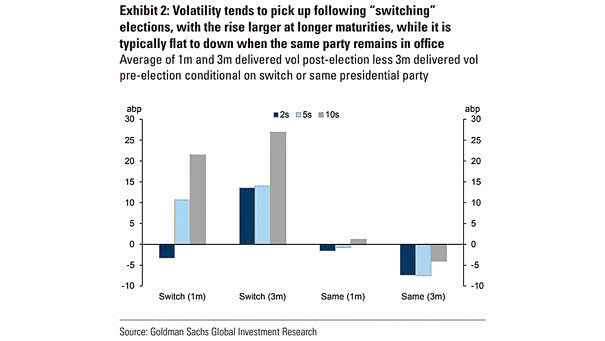
Volatility and U.S. Elections This chart shows how U.S. presidential elections affect volatility when the same party remains in office or not. Image: Goldman Sachs Global Investment Research
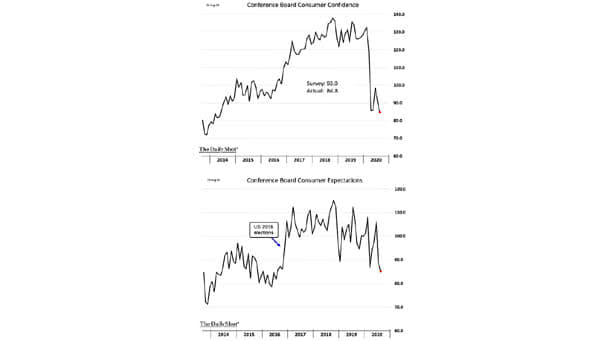
Conference Board Consumer Confidence U.S. consumer confidence falls in August, as more and more companies announce layoffs. Image: The Daily Shot
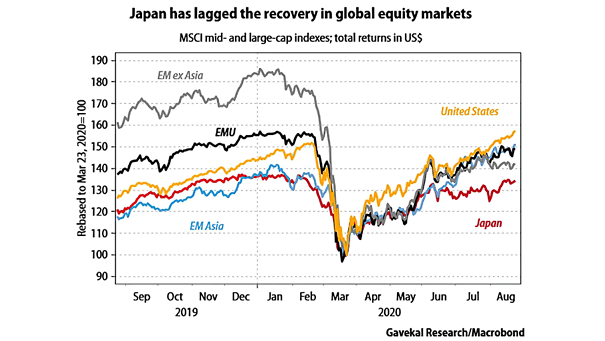
Japan and Global Equity Markets With a soft domestic economy, Japan’s equity market has lagged global equities. Image: Gavekal, Macrobond