S&P 500 Total Return / S&P 500 Equally Weighted Total Return
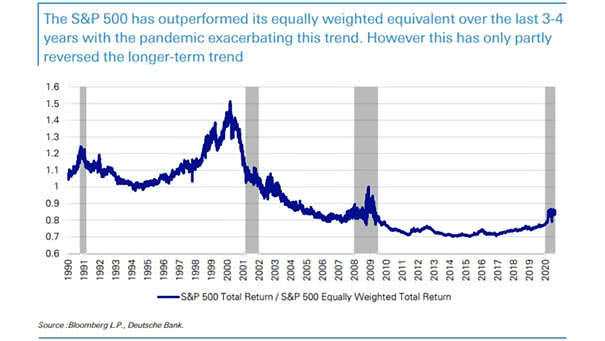
S&P 500 Total Return / S&P 500 Equally Weighted Total Return Will the S&P 500 continue to outperform its equally weighted equivalent? Image: Deutsche Bank
S&P 500 Total Return / S&P 500 Equally Weighted Total Return Will the S&P 500 continue to outperform its equally weighted equivalent? Image: Deutsche Bank
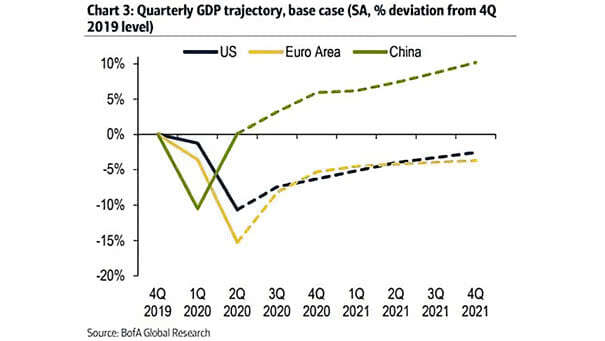
Quarterly GDP Trajectory, Base Case – U.S., Euro Area and China This chart suggests the base case scenario for 2020/2021 GDP growth. Image: BofA Global Research
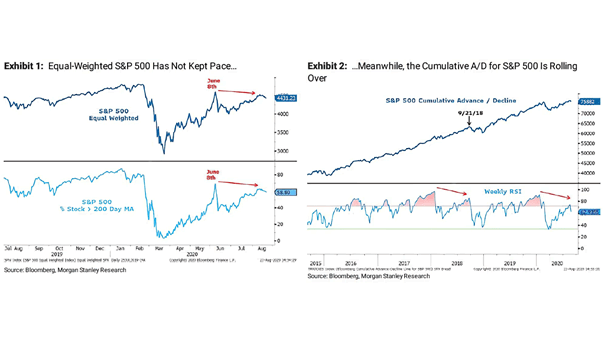
Equal-Weighted S&P 500 and S&P 500 Cumulative Advance/Decline Charts suggesting that a market correction may begin soon, as the S&P 500 cumulative advance/decline line fails to confirm the new all-time highs. Image: Morgan Stanley Research
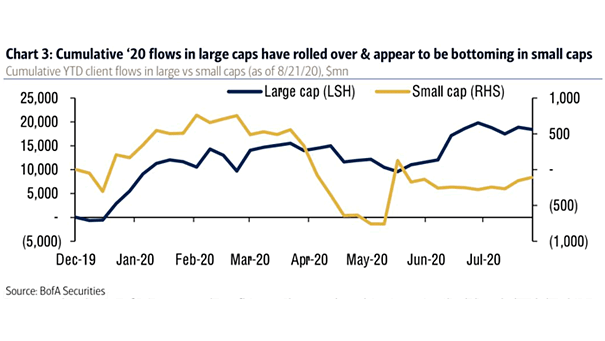
Cumulative YTD Flows in Large vs. Small Cap Stocks BofA’s clients sell large cap stocks and buy small caps, amid new market highs. Image: BofA Securities
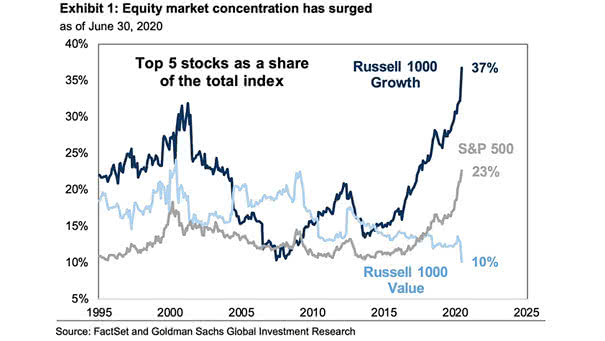
Market Capitalization – Top 5 Stocks as a Share of the Total Index The market capitalization of the five largest companies now accounts for 37% of the Russell 1000 Growth Index. Image: Goldman Sachs Global…

Performance – Return from the S&P 500’s Prior High on Feb. 19 to the New All-Time High Despite the S&P 500 new all-time high, a majority of S&P 500 stocks are down significantly from where…
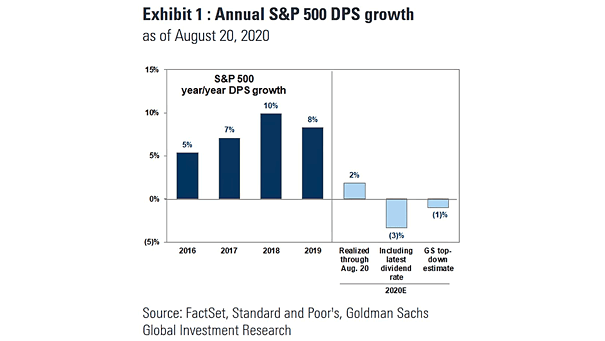
Dividends – Annual S&P 500 DPS Growth Goldman Sachs expects that the pace of dividend cuts will moderate. Image: Goldman Sachs Global Investment Research
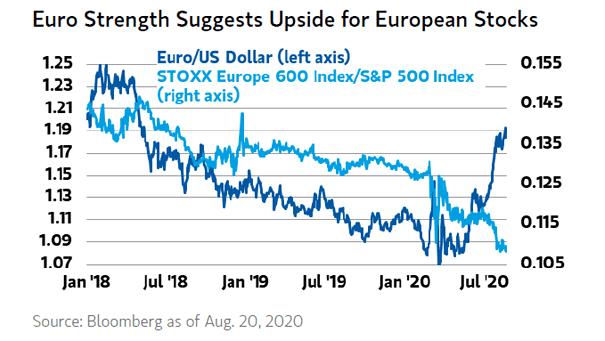
Euro/U.S. Dollar vs. Stoxx Europe 600 Index/S&P 500 Index Does the strength of the euro make European stocks a buying opportunity? Image: Morgan Stanley Wealth Management
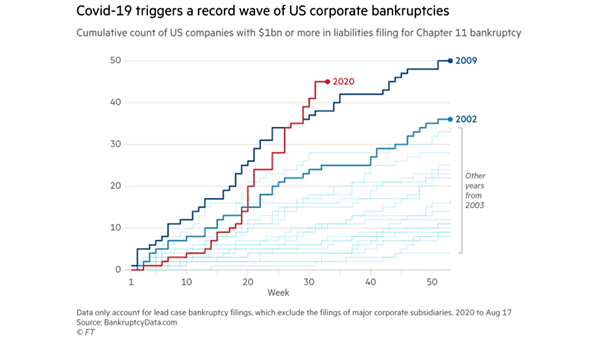
Coronavirus Crisis and U.S. Corporate Bankruptcies The coronavirus crisis triggers a record number of U.S. corporate bankruptcies, despite record levels of federal aid. Image: Financial Times
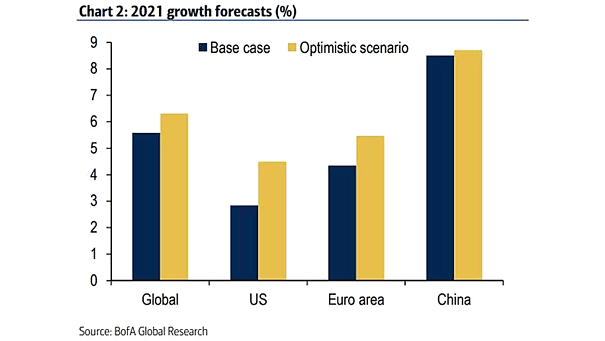
2021 GDP Growth Forecasts Chart suggesting possible scenarios for 2021 growth. Image: BofA Global Research
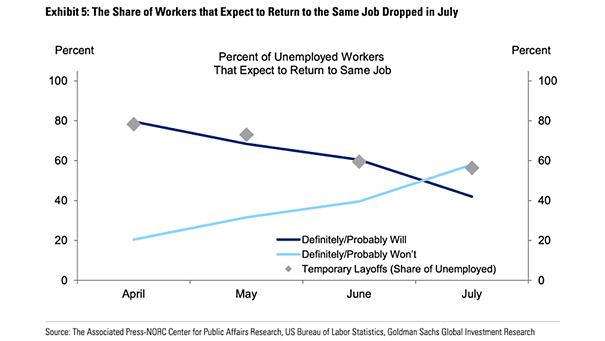
Percent of Unemployed U.S. Workers that Expect to Return to Same Job Goldman Sachs expects that a quarter of temporary layoffs will become permanent. Image: Goldman Sachs Global Investment Research