Life Satisfaction and Income
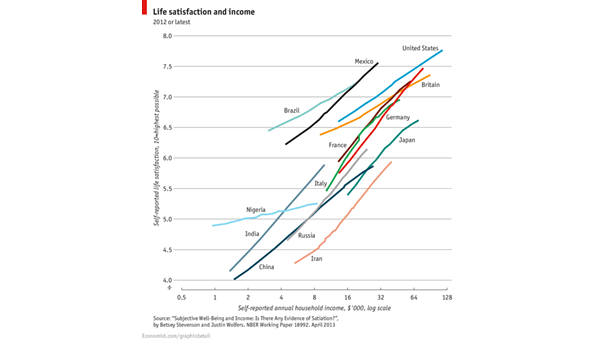
Life Satisfaction and Income Does money buy happiness? This chart suggests that life satisfaction and income tend to go hand-in-hand. Image: The Economist
Life Satisfaction and Income Does money buy happiness? This chart suggests that life satisfaction and income tend to go hand-in-hand. Image: The Economist
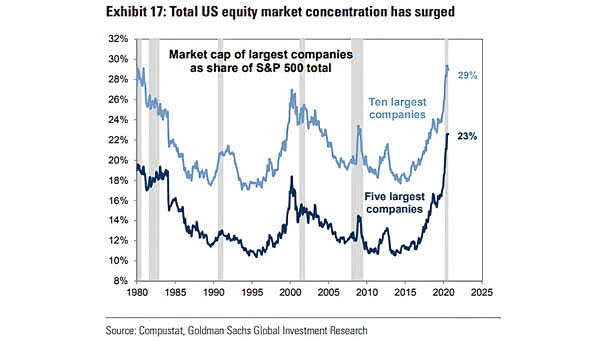
Market Capitalization of Largest Companies as Share of S&P 500 Total Chart showing the record level of concentration in the U.S. equity market. Image: Goldman Sachs Global Investment Research
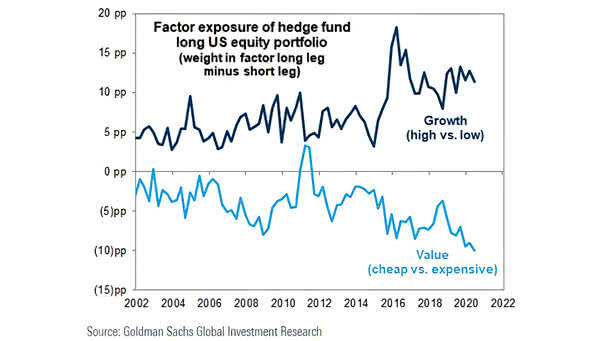
Factor Exposure of Hedge Fund Long U.S. Equity Portfolio Growth stocks remain among the most popular choices for hedge funds. Image: Goldman Sachs Global Investment Research
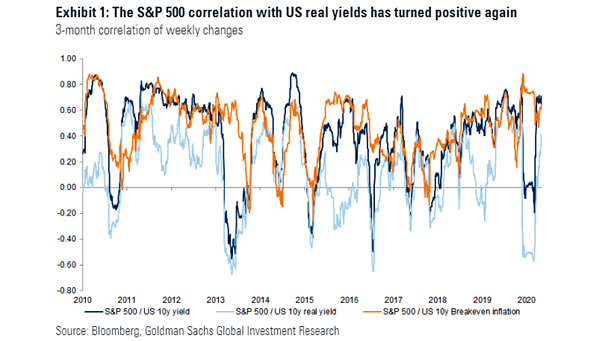
S&P 500 Correlation with U.S. Real Yield The correlation of the S&P 500 with real yields has been negative for most of this year, but it has turned positive again. Image: Goldman Sachs Global Investment…
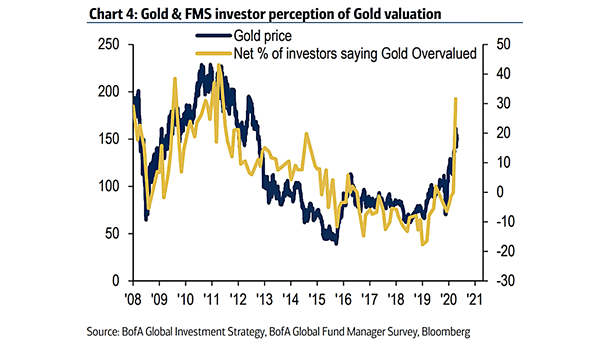
Gold Price and Net % of Investors Saying Gold Overvalued Is gold overvalued at current levels? Is gold currently overvalued? Image: BofA Global Investment Strategy

U.S. Bull Markets Throughout History The new bull market was confirmed this week, and it’s already almost 5 months old. Image: CNBC
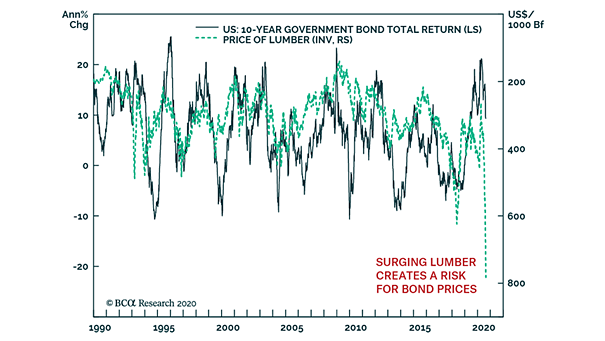
U.S. 10-Year Government Bond Total Return vs. Price of Lumber The surge in lumber prices suggests downside risk for bond prices. Image: BCA Research
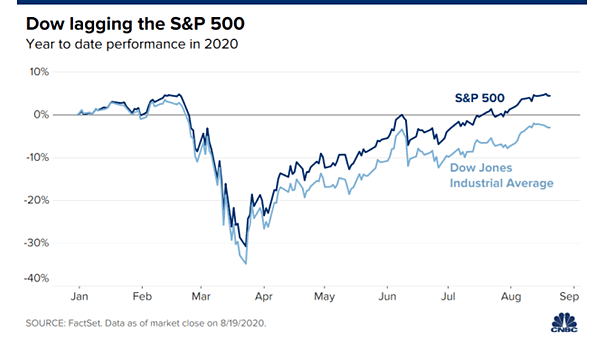
Dow Jones Industrial Average vs. S&P 500 The Dow Jone Industrial Average is lagging the S&P 500, as it is underweight in technology and overweight in financials and industrials. Image: CNBC
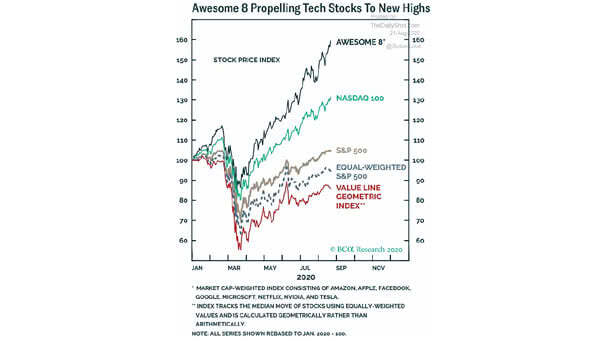
Mega-Cap Growth Stocks – Awesome 8 “Awesome 8” stocks are up around 60% YTD, while median US stocks are down 14% YTD. Image: BCA Research
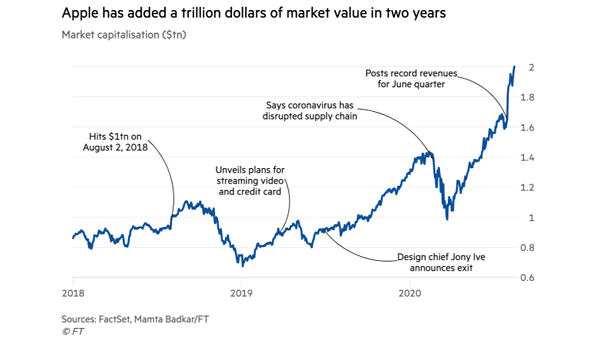
Apple Stocks – Market Capitalization Apple hit a market capitalization of $2 trillion. But is the stock a buying opportunity? Image: Financial Times
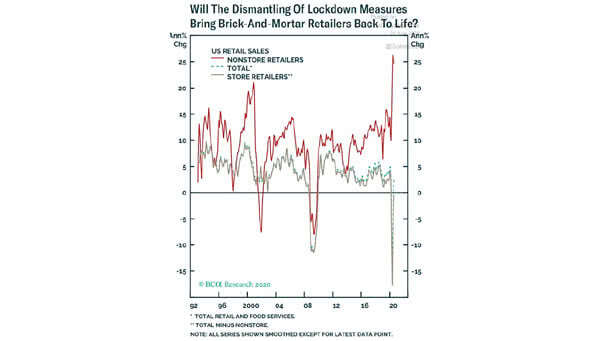
U.S. Retail Sales – Store Retailers vs. Nonstore Retailers Can U.S. store retailers come back to life as the lockdown eases? Image: BCA Research