Bitcoin Options vs. Futures Open Interest
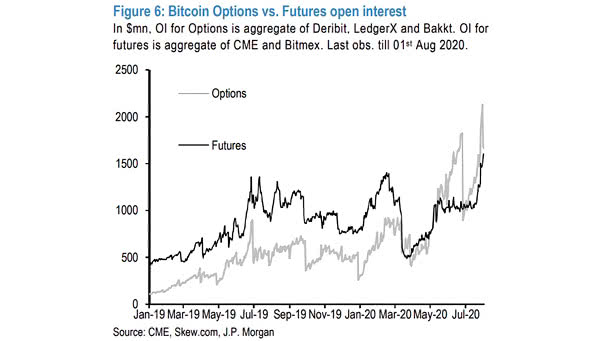
Bitcoin Options vs. Futures Open Interest Bitcoin options and futures open interest is growing rapidly this quarter. Image: J.P. Morgan
Bitcoin Options vs. Futures Open Interest Bitcoin options and futures open interest is growing rapidly this quarter. Image: J.P. Morgan
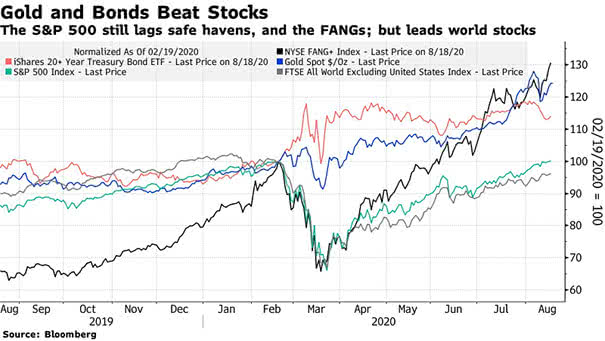
Performance – Gold and Bonds Beat Stocks Will gold and bonds continue to outperform equities? Image: Bloomberg
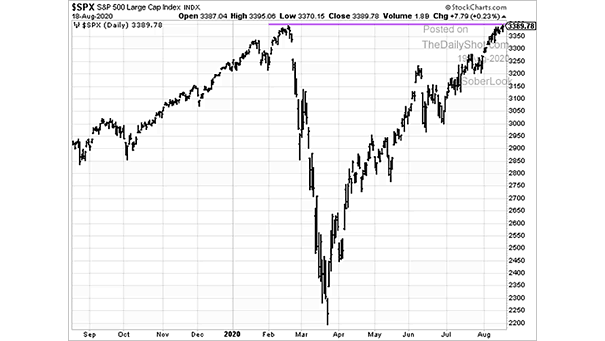
S&P 500 At All-Time High Despite the coronavirus pandemic, the S&P 500 hits all-time high, but is testing resistance. Image: StockCharts
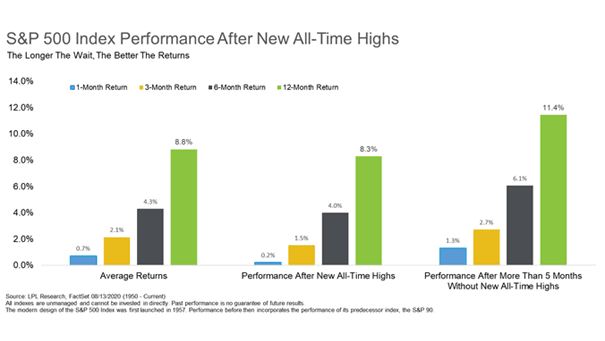
S&P 500 Index Performance After New All-Time Highs Historically, the S&P 500 Index performance has been much better (on average) after more than 5 months without a new high. Image: LPL Research
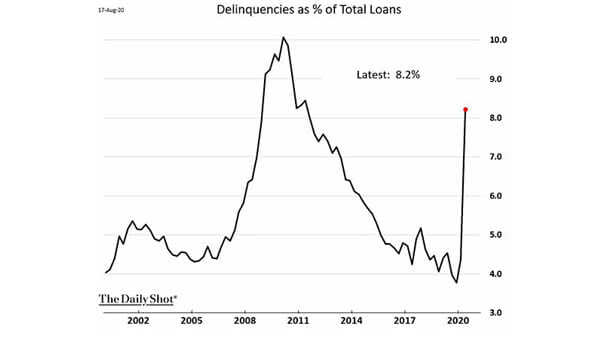
Delinquencies as % of Total Loans This chart shows the highest mortgage delinquency rate in nine years. Image: The Daily Shot

Estimated S&P 500 Earnings Impact Based on Biden’s Proposals Joe Biden’s tax proposal could significantly reduce S&P 500 earnings, if passed into law. Image: BofA US Equity & Quant Strategy
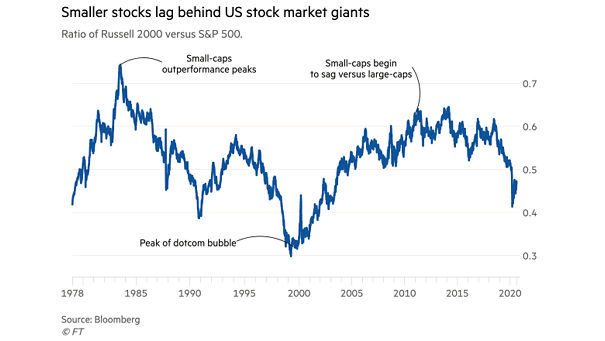
U.S. Small Caps – Ratio of Russell 2000 vs. S&P 500 Chart suggesting that small stocks are no longer providing big gains for investors Image: Financial Times
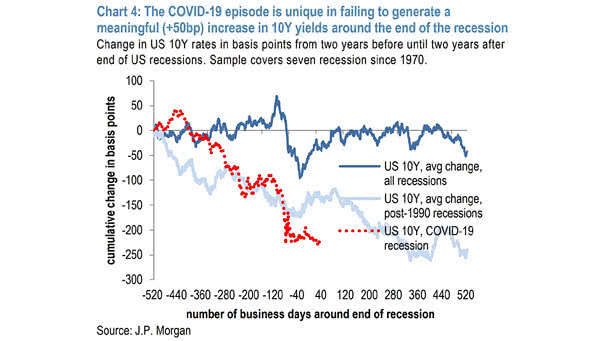
U.S. 10-Year Yields Around the End of the Recession The coronavirus pandemic has depressed the 10-year yield, leaving it stuck, even as the stock market rebounds. Image: J.P. Morgan
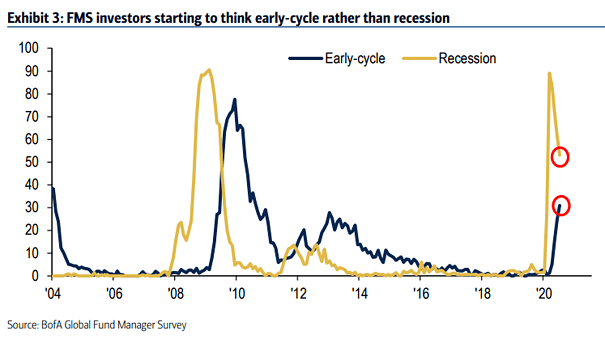
FMS Investors – Early-Cycle vs. Recession FMS investors are becoming more optimistic, starting to think early-cycle rather than recession. Image: BofA Global Fund Manager Survey
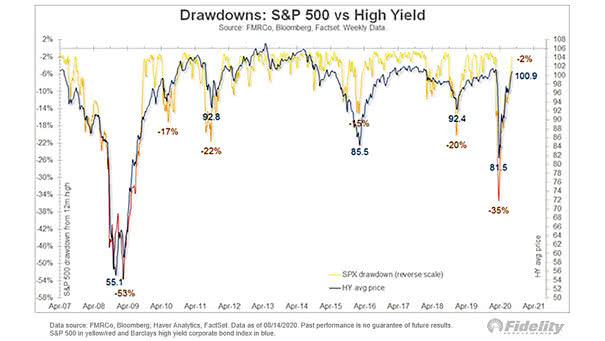
Drawdowns – S&P 500 vs. High Yield The high-yield sector has been relatively resilient during the recent drawdown episode. Image: Fidelity Investments
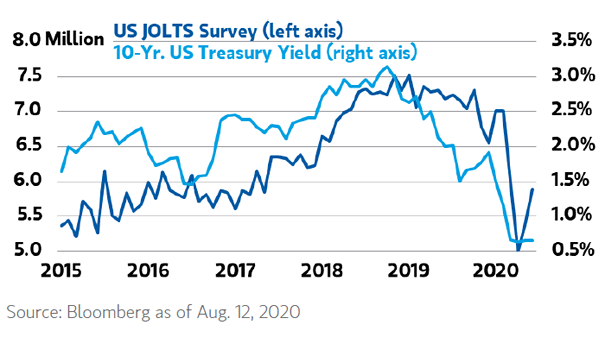
U.S. JOLTS Survey vs. 10-Year U.S. Treasury Yield As macroeconomic data continue to improve, how long can yields resist the recovery? Image: Morgan Stanley Wealth Management