Bull Markets – Gold and Tech
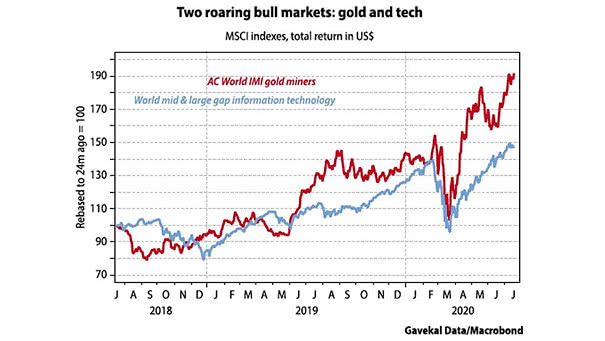
Bull Markets – Gold and Tech Trees don’t grow to the sky, but so far, gold and tech are darlings of the market. Image: Gavekal, Macrobond
Bull Markets – Gold and Tech Trees don’t grow to the sky, but so far, gold and tech are darlings of the market. Image: Gavekal, Macrobond
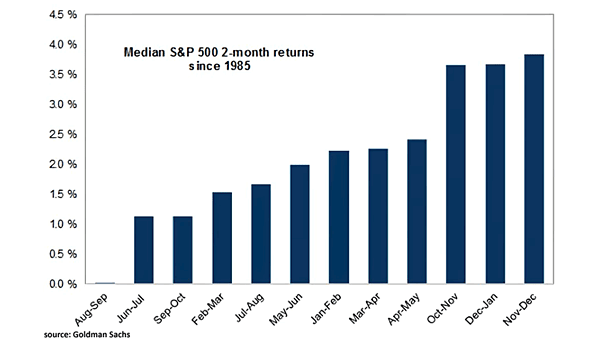
Seasonality – Median S&P 500 2-Month Returns since 1985 Since 1985, August and September have been the two worst months of the year for the S&P 500. Image: Goldman Sachs Global Investment Research
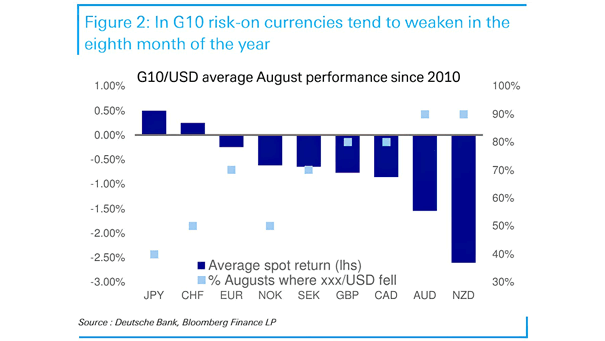
G10/USD Average August Performance Since 2010 Since 2010, G10 risk-on currencies tend to weaken in August. Image: Deutsche Bank
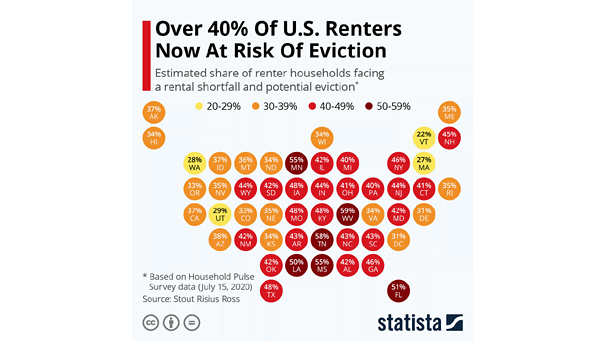
Estimated Share of Renter Households Facing a Rental Shortfall and Potential Eviction More than 40% of U.S. renters are at risk of eviction, as the Federal eviction moratorium has expired. Image: Statista
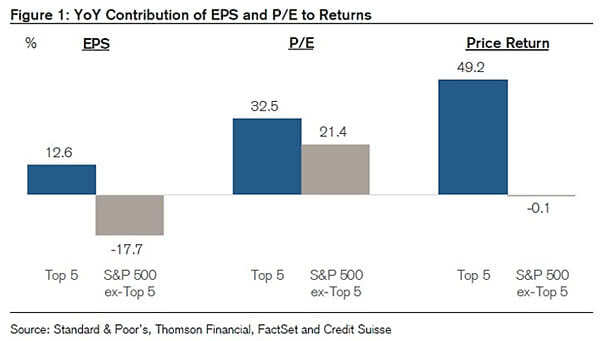
Top 5 vs. S&P 500 ex-Top 5 – YoY Contribution of EPS and P/E to Returns The performance gap could widen further, as the top 5 largest stocks in the S&P 500 are superior on…
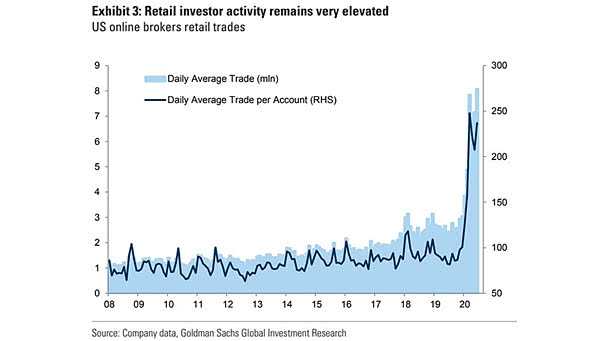
U.S. Online Brokers Retail Trades and Individual Investors The move to zero commissions and the lockdowns boosted individual investor trades. Image: Goldman Sachs Global Investment Research
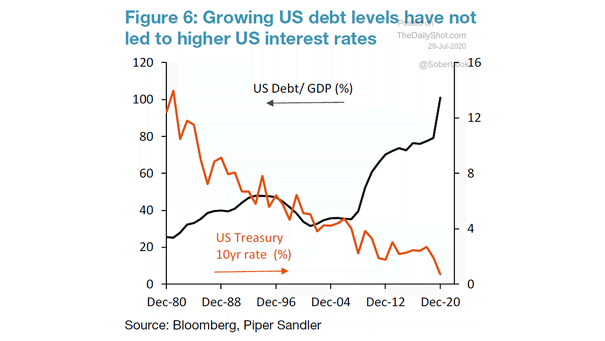
U.S. Debt-to-GDP vs. U.S. Treasury 10-Year Rate Low U.S. interest rates also make public debt less costly. Image: Piper Sandler
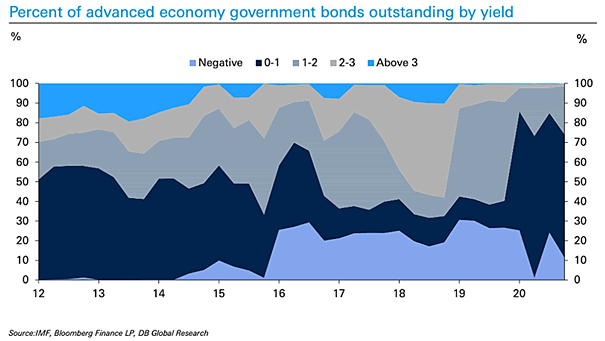
Percent of Advanced Economy Government Bonds Outstanding by Yield As the chart shows, there is currently a large percentage of government bonds from advanced economies with yields below 1%. Image: Deutsche Bank Global Research
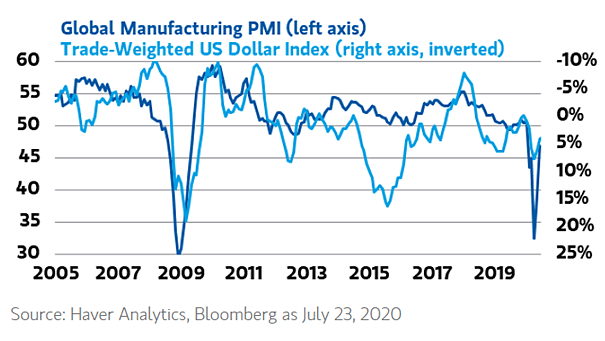
Trade-Weighted U.S. Dollar Index vs. Global Manufacturing PMI A stronger global growth could lead to a weaker U.S. dollar. Image: Morgan Stanley Research
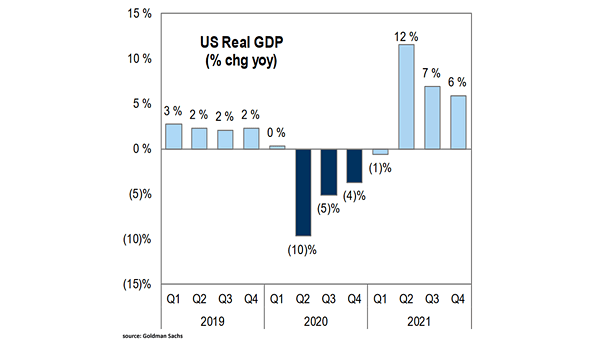
U.S. Real GDP Forecast (YoY Change) U.S. Real GDP (year-over-year change) should be positive in the second quarter of 2021. Image: Goldman Sachs Global Investment Research
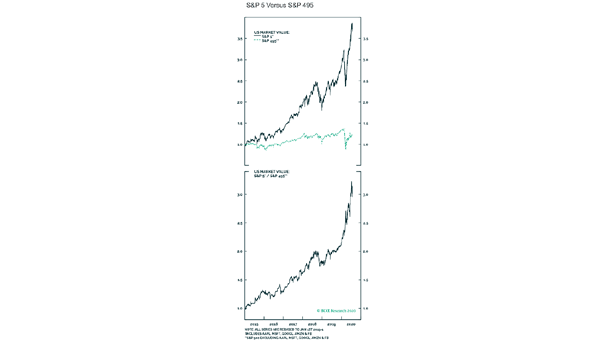
S&P 500 – S&P 5 vs. S&P 495 This chart highlights the outperformance of the biggest five companies in the S&P 500 vs. the remaining 495 stocks. Image: BCA Research