Composition of Household Total Assets
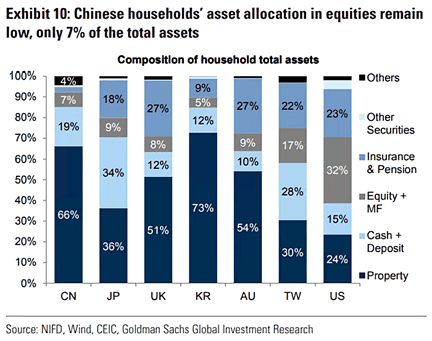
Composition of Household Total Assets Chinese households are under invested in equities, with only 7% of total assets compared to 32% for U.S. households. Image: Goldman Sachs Global Investment Research
Composition of Household Total Assets Chinese households are under invested in equities, with only 7% of total assets compared to 32% for U.S. households. Image: Goldman Sachs Global Investment Research
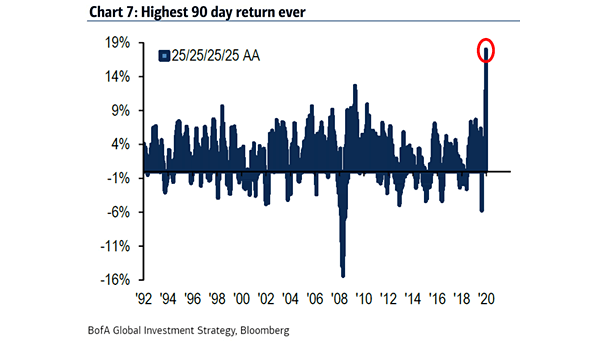
All Weather Portfolio (Stocks, Bonds, Cash and Gold) The All Weather Portfolio of 25/25/25/25 in stocks, bonds, cash and gold is up 18% over the past 90 days, the highest return ever. Image: BofA Global…
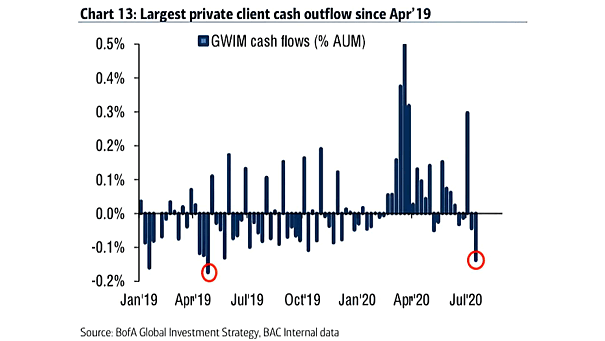
GWIM Cash Flows This chart shows the largest cash outflow from BofA’s private clients since April 2019, while there has been a lot of cash inflow this year. Image: BofA Global Investment Strategy
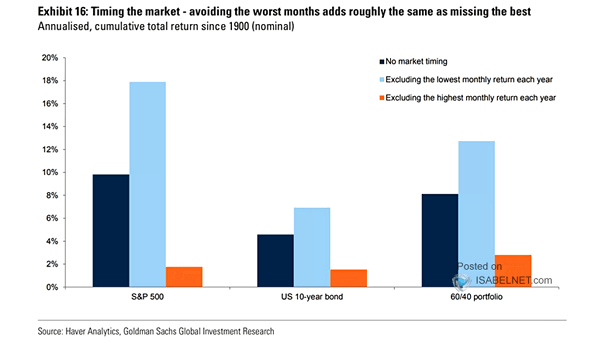
S&P 500, U.S. 10-Year Bond and 60/40 Portfolio – Cumulative Total Return Since 1900 Is market timing a good idea? Image: Goldman Sachs Global Investment Research
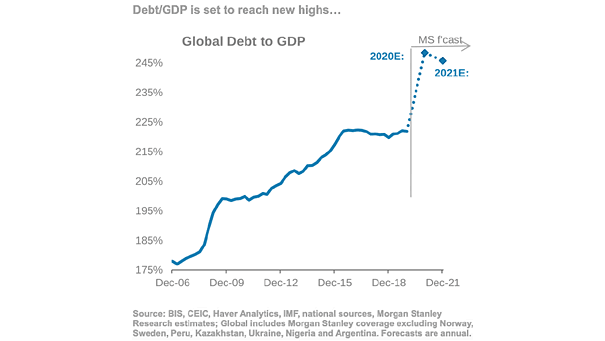
Global Debt to GDP Global debt to GDP is expected to reach a new high of 249% of GDP this year, and 246% in 2021. Image: Morgan Stanley Research
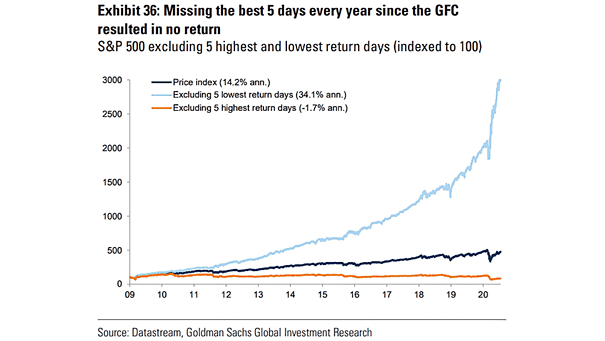
S&P 500 Excluding Five Highest and Lowest Return Days As the chart suggests, mistiming the U.S. stock market can be disastrous. Image: Goldman Sachs Global Investment Research

U.S. AAII Investor Sentiment U.S. AAII investors remain bearish on stocks. Image: BCA Research
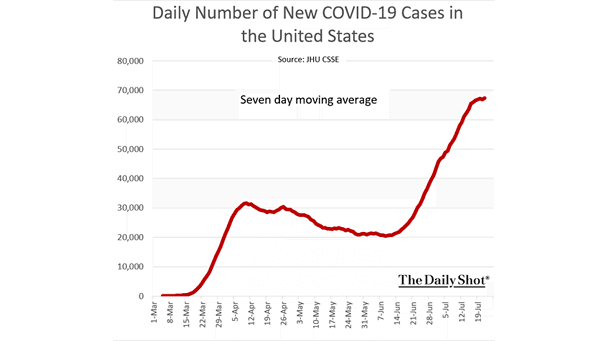
Coronavirus – Daily Number of New COVID-19 Cases in the U.S. The United States surpasses 4 million officially reported coronavirus cases, while COVID-19 cases keep climbing. Image: The Daily Shot
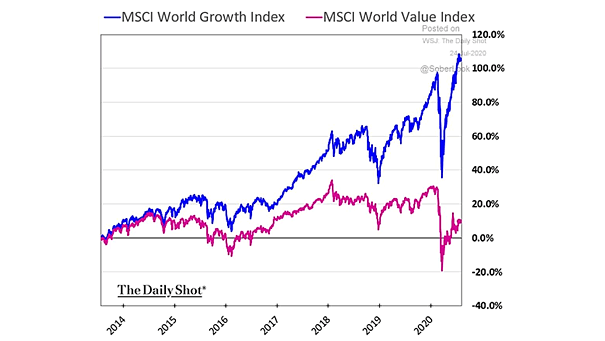
MSCI World Growth Index vs. MSCI World Value Index Will global value stocks outperform global growth stocks in the recovery phase? Image: The Daily Shot
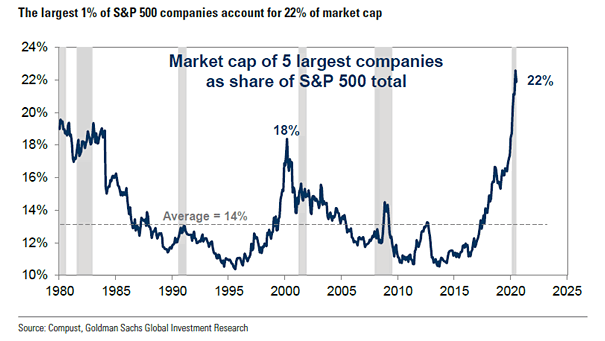
S&P 500 – Market Capitalization of Five Largest Companies The market capitalization of the five largest companies now accounts for 22% of S&P 500 total, while the average is 14%. Image: Goldman Sachs Global Investment…

U.S. 10-Year Real Yields – Year-to-Date Changes Since 1998 U.S. 10-year real yields (TIPS) hit all-time low and are falling at their fastest pace on record. Image: Arbor Research & Trading LLC