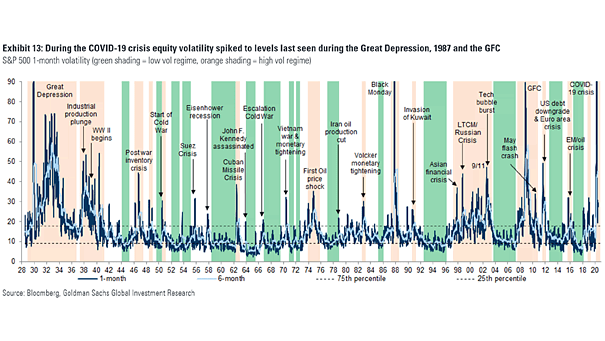
S&P 500 Volatility History
S&P 500 Volatility History The stock market crash of 1929, the Black Monday of 1987, the global financial crisis in 2008, and the COVID-19 crisis were the most extreme events. Image: Goldman Sachs Global Investment…
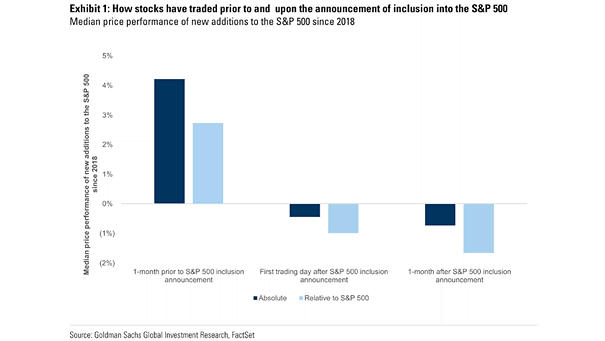
Median Price Performance of New Additions to the S&P 500 since 2018
Median Price Performance of New Additions to the S&P 500 since 2018 Chart suggesting what S&P 500 inclusion could mean for individual stocks, like Tesla. Image: Goldman Sachs Global Investment Research
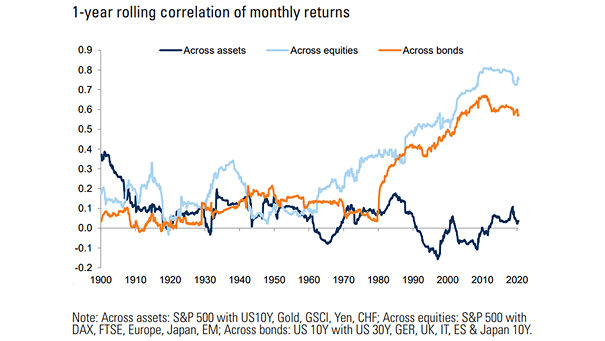
Correlation Across Assets
Correlation Across Assets The 1-year rolling correlation remains low between asset classes for diversification. Image: Goldman Sachs Global Investment Research
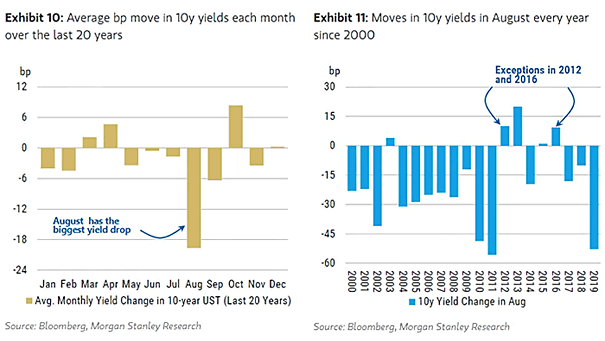
Seasonality – Average Bp Move in 10-Year U.S. Treasury Bond Yields
Seasonality – Average Bp Move in 10-Year U.S. Treasury Bond Yields Will August be a positive month for U.S. Treasury bonds this year? Image: Morgan Stanley Research
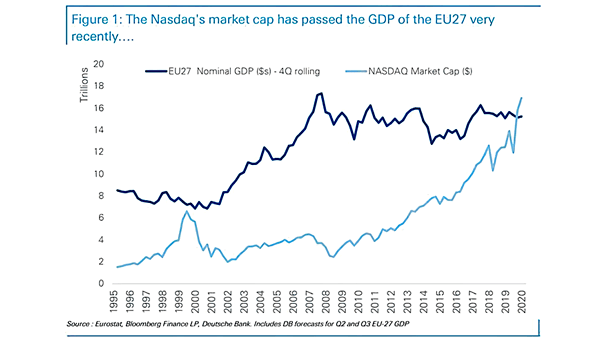
EU27 Nominal GDP vs. Nasdaq Market Capitalization
EU27 Nominal GDP vs. Nasdaq Market Capitalization Is tech in a bubble? The Nasdaq market capitalization is now bigger than the nominal GDP (in U.S. dollars) of the European Union’s 27 member countries. Image: Deutsche…
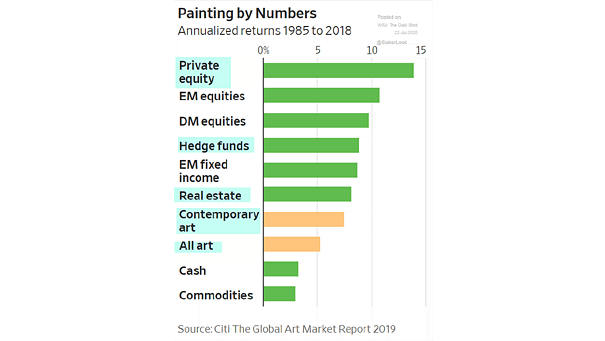
Annualized Returns by Asset Classes from 1985 to 2018
Annualized Returns by Asset Classes from 1985 to 2018 Art generated annualized returns of 5.3% between 1985 and 2018, and significantly underperformed private-equity, DM and EM equities. Image: The Wall Street Journal
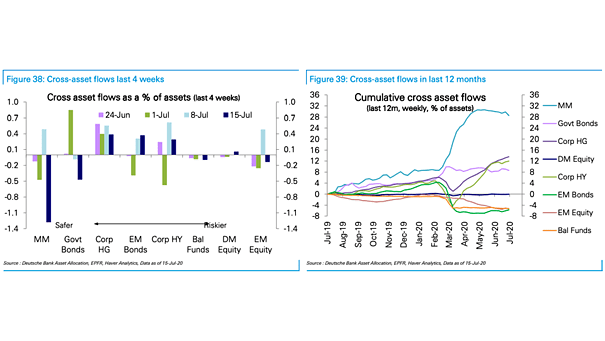
Cross Asset Flows
Cross Asset Flows As the chart shows, equity flows have been particularly weak in the last 12 months. Image: Deutsche Bank Asset Allocation
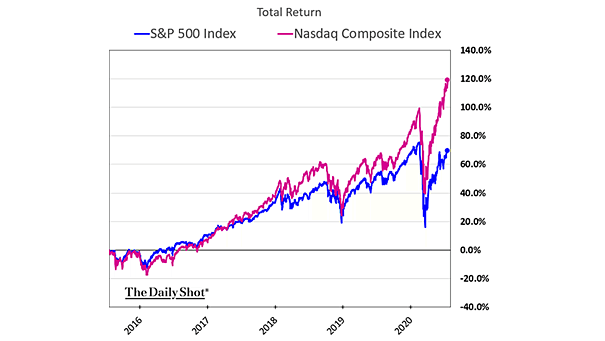
Performance – S&P 500 vs. Nasdaq
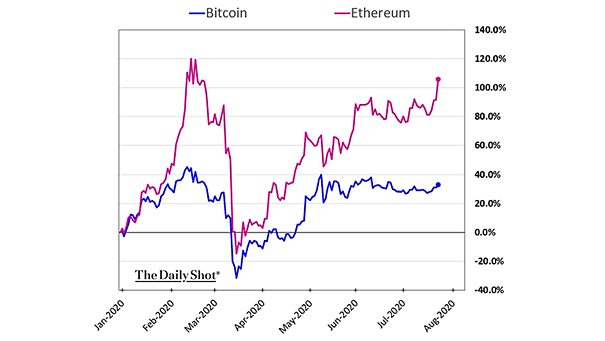
Performance – S&P 500 vs. Nasdaq Will the Nasdaq continue to outperform the S&P 500? Image: The Daily Shot
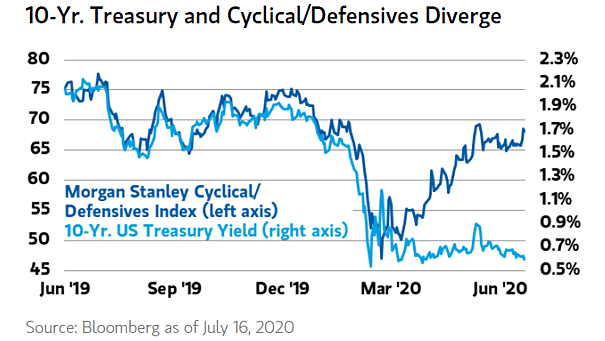
10-Year U.S. Treasury Yield vs. Cyclical to Defensives Stock Ratio
10-Year U.S. Treasury Yield vs. Cyclical to Defensives Stock Ratio The divergence between the 10-year U.S. Treasury yield and the cyclical to defensives stock ratio suggests higher yields ahead. Image: Morgan Stanley Research
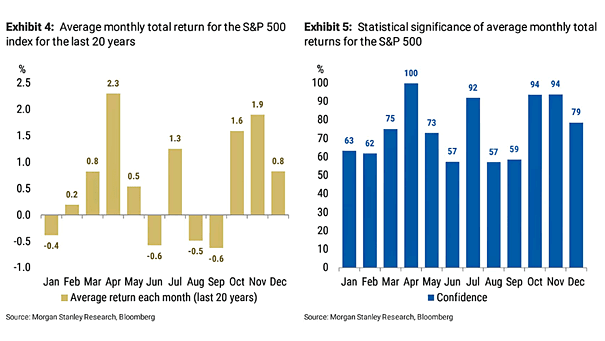
Seasonality – Average Monthly Total Return for the S&P 500 Index and Statistical Significance
Seasonality – Average Monthly Total Return for the S&P 500 Index and Statistical Significance Over the past 20 years, July has been positive on average with a high confidence level. Image: Morgan Stanley Research