U.S. Labor Market Recovery
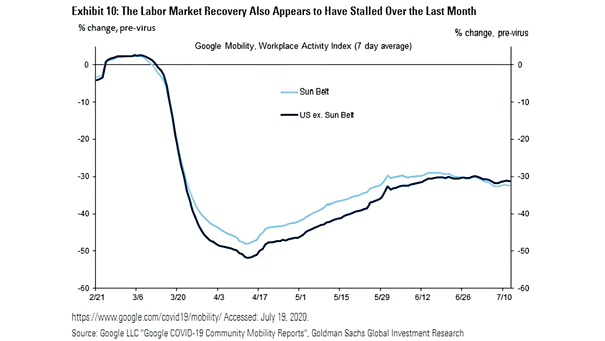
U.S. Labor Market Recovery Chart suggesting that the U.S. labor market recovery is stalling. Image: Goldman Sachs Global Investment Research
U.S. Labor Market Recovery Chart suggesting that the U.S. labor market recovery is stalling. Image: Goldman Sachs Global Investment Research
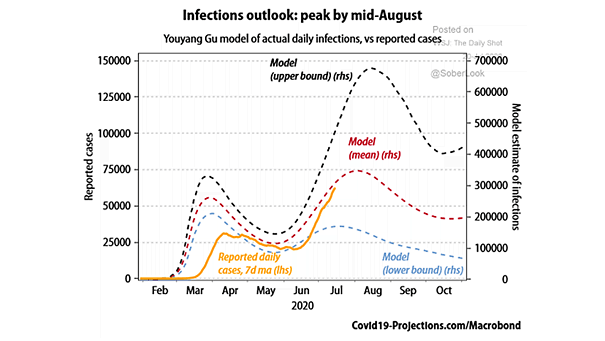
Coronavirus – U.S. Infections Outlook U.S. infections are expected to peak by mid-August. Image: Gavekal, Macrobond
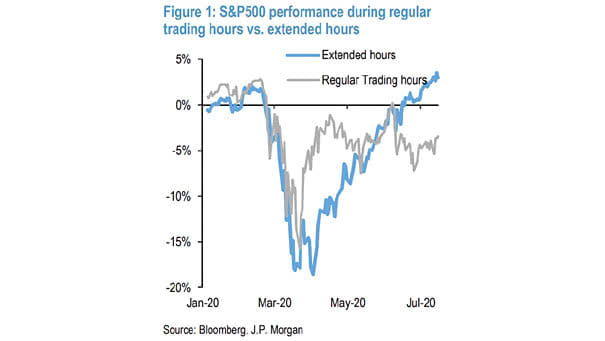
S&P 500 Performance During Regular Trading Hours vs. Extended Hours Chart showing the performance divergence between regular trading hours and extended hours. Image: J.P. Morgan
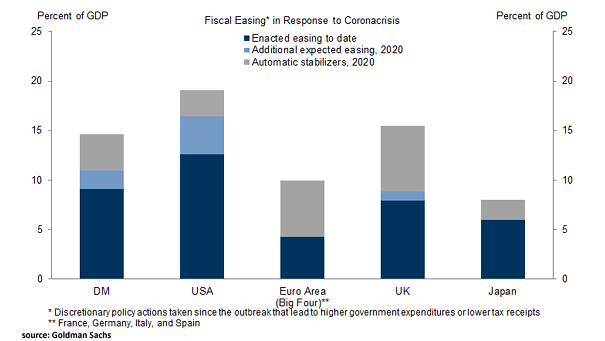
Fiscal Policy Easing Response to Coronavirus Crisis The U.S. fiscal response to the coronavirus crisis is massive. Image: Goldman Sachs Global Investment Research
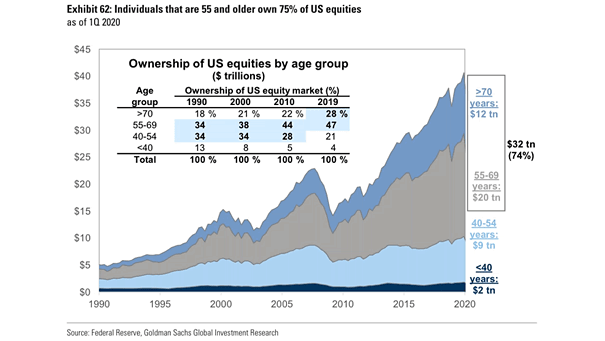
Ownership of U.S. Equities by Age Group Young individuals are less likely than their elders to own U.S. equities. Image: Goldman Sachs Global Investment Research
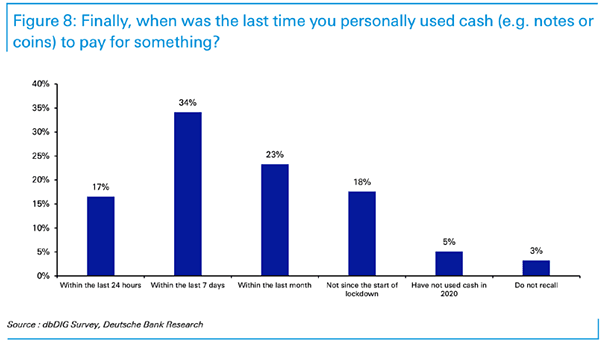
Use of Cash Is this the end of cash? The use of cash is declining faster than it did before the coronavirus pandemic. Image: Deutsche Bank Research
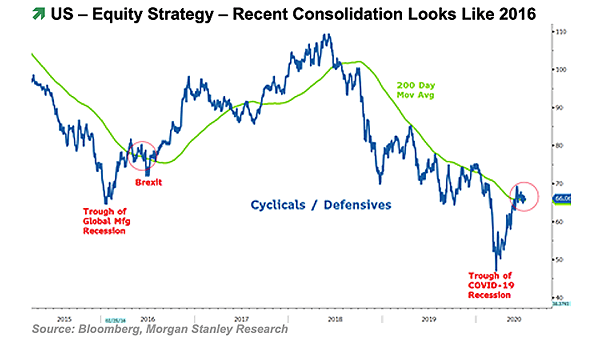
U.S. Equity Strategy – Cyclicals vs. Defensives and S&P 500 Morgan Stanley suggests that the S&P 500 has potential downside to 2800-2850, as the correction in early June is likely not over. Image: Morgan Stanley…
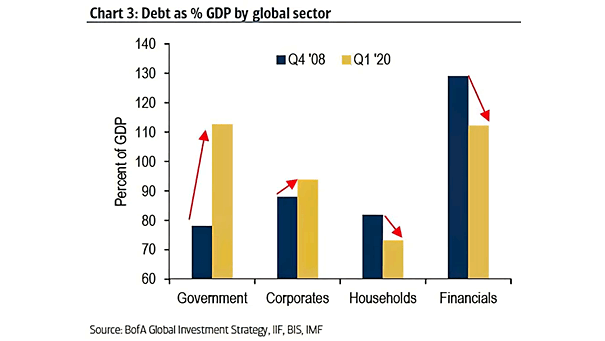
Debt as % of GDP by Global Sector Since the Global Financial Crisis, debt as % of GDP is much higher in the government and corporate sectors. Image: BofA Global Investment Strategy
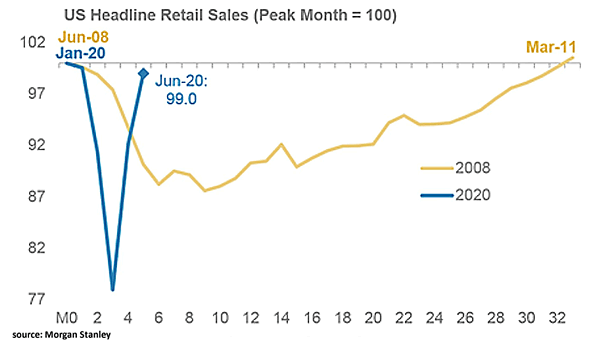
U.S. Headline Retail Sales U.S. retail sales look V-shaped, but can it last? Image: Morgan Stanley Research
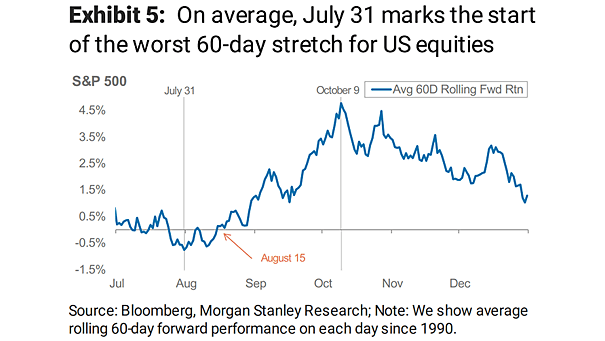
Seasonality – S&P 500 60-Day Rolling Forward Return On average, July 31 marks the start of the worst 60-day stretch for the S&P 500 since 1990. Image: Morgan Stanley Research
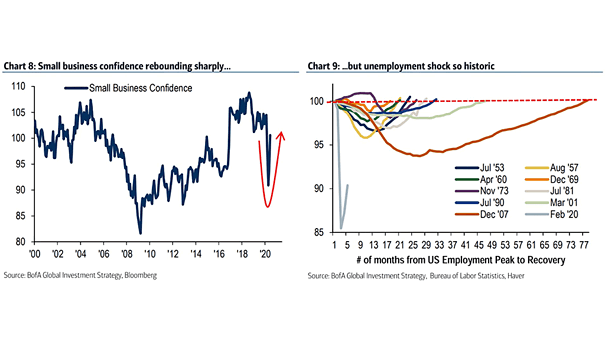
U.S. Small Business Confidence and U.S. Employment Peak to Recovery Small business confidence is rebounding, but it could take many years for the U.S. labor market to recover. Image: BofA Global Investment Strategy