Flow – % Share of Rolling Three-Month ETF Inflows
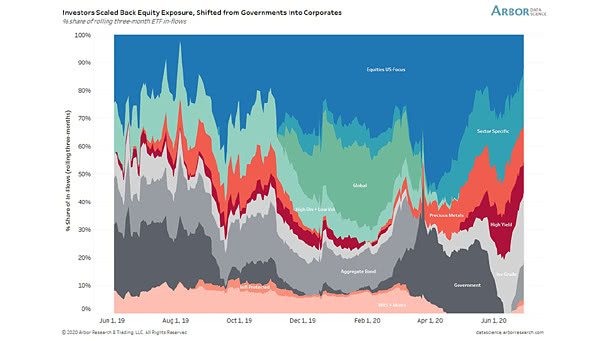
Flow – % Share of Rolling Three-Month ETF Inflows Investors reduced their equity exposure. Over the past 3 months, nearly 50% of all ETF inflows have funneled into HY, IG and Agg bonds. Image: Arbor…
Flow – % Share of Rolling Three-Month ETF Inflows Investors reduced their equity exposure. Over the past 3 months, nearly 50% of all ETF inflows have funneled into HY, IG and Agg bonds. Image: Arbor…

Total Number of S&P 500 Guidance Instances The number of S&P 500 companies providing guidance declines over time. Image: BofA US Equity & US Quant Strategy
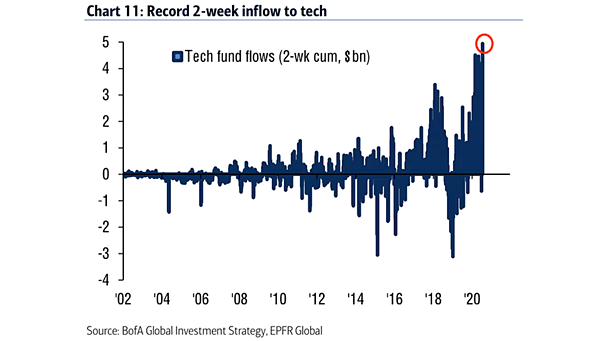
Flows into Tech Funds Potential bubble? Tech funds saw the largest 2-week inflow ever. Image: BofA Global Investment Strategy
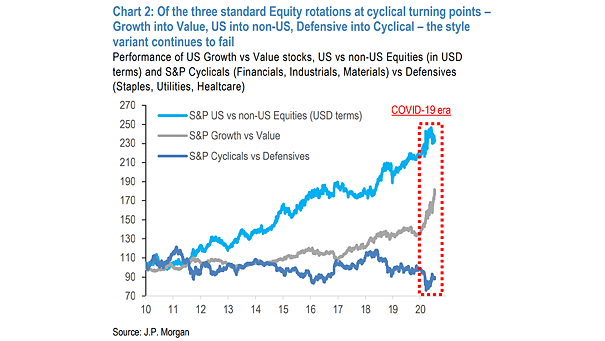
Performance of U.S. Growth vs. Value Stocks, U.S. vs. non-U.S. Equities and S&P Cyclicals vs. Defensives Equity rotation are delivering for non-U.S. vs. U.S. markets and Cyclicals vs. Defensives, but not for Value vs. Growth.…
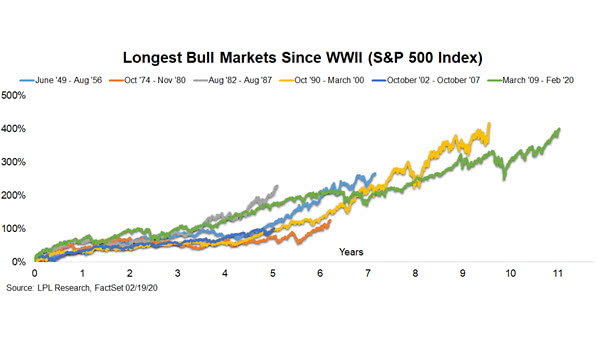
S&P 500 Index – Longest Bull Markets since WWII Chart showing every bull market since WWII. The recent bull market peaked at 400%. Image: LPL Research
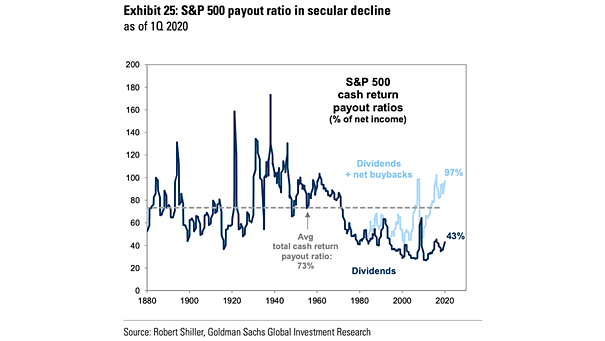
S&P 500 Cash Return Payout Ratios (% of Net Income) S&P 500 payout ratio is in secular decline, as S&P 500 companies shift to buybacks. Image: Goldman Sachs Global Investment Research
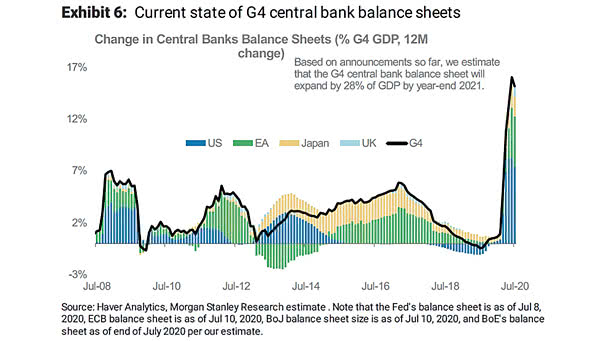
Change in G4 Central Bank Balance Sheets (% G4 GDP, 12M Change) G4 central bank balance sheets are expected to expand by 28% of GDP by year-end 2021. Image: Morgan Stanley Research
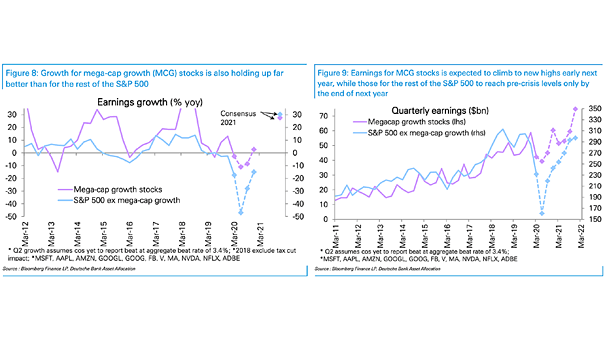
Earnings Growth – Mega-Cap Growth Stocks vs. S&P500 ex Mega-Cap Growth Earnings for mega-cap growth stocks are expected to reach new highs in early 2021. That’s far better than the rest of the S&P 500.…
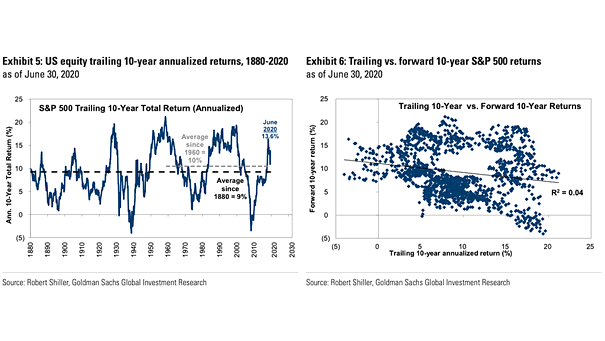
S&P 500 Trailing 10-Year Total Return vs. Forward 10-Year Returns Historically, forward 10-year S&P 500 returns are not correlated with trailing 10-year returns. Image: Goldman Sachs Global Investment Research
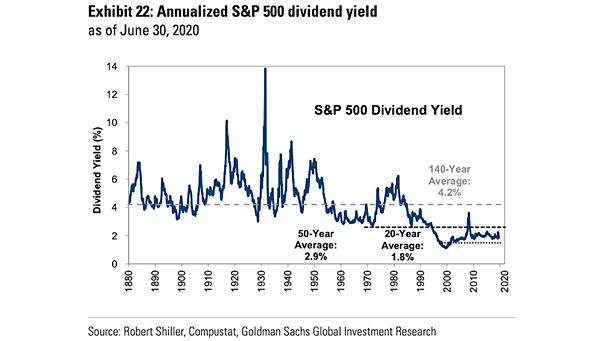
Annualized S&P 500 Dividend Yield The S&P 500 dividend yield has averaged only 1.8% over the past 20 years vs. 2.9% since 1950 and 4.2% since 1880. Image: Goldman Sachs Global Investment Research
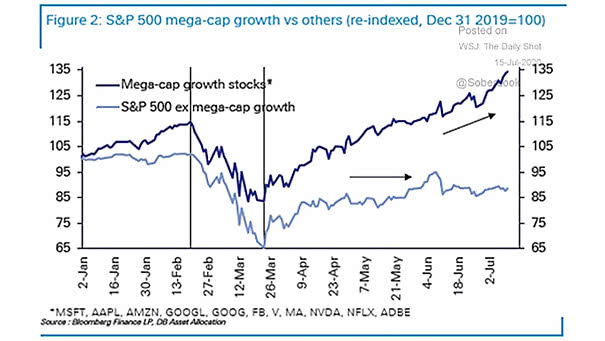
Mega-Cap Growth Stocks vs. S&P500 ex Mega-Cap Growth The 10 mega-cap growth stocks hit new record highs, while the remaining 490 stocks are stuck in a range. Image: Deutsche Bank Asset Allocation