Gold Price and Forecast 5-Year Real Rates
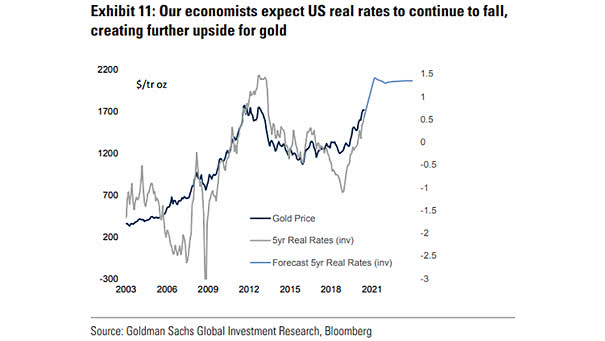
Gold Price and Forecast 5-Year Real Rates Goldman Sachs expects U.S. real rates to continue to fall, and raised its 12-month forecast on gold to $2000/toz. Image: Goldman Sachs Global Investment Research
Gold Price and Forecast 5-Year Real Rates Goldman Sachs expects U.S. real rates to continue to fall, and raised its 12-month forecast on gold to $2000/toz. Image: Goldman Sachs Global Investment Research
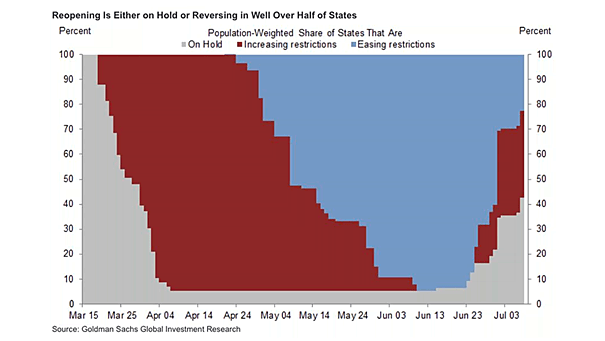
Coronavirus – Tightening and Easing Restrictions in the U.S. Tightening restrictions are rising, as daily coronavirus cases spike in the U.S. Image: Goldman Sachs Global Investment Research
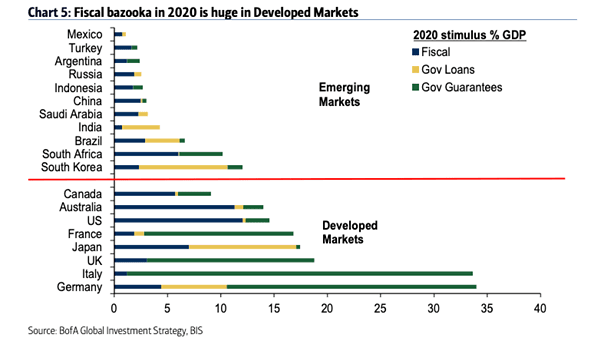
2020 Stimulus as % of GDP – Emerging Markets vs. Developed Markets The 2020 stimulus is massive, especially in developed markets Image: BofA Global Investment Strategy
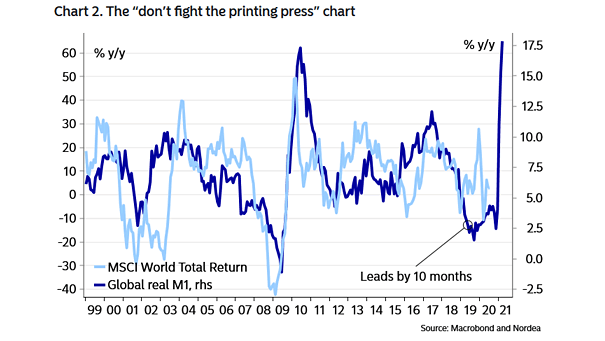
Global Real M1 vs. MSCI World Total Return (Leading Indicator) Global real M1 suggests that 2021 could be a good year for risky assets. Image: Nordea and Macrobond
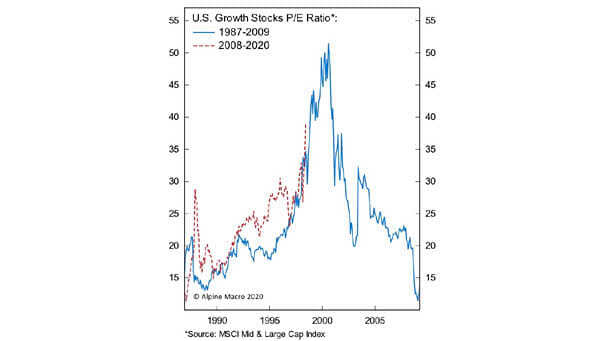
U.S. Growth Stocks P/E Ratio: 1987-2009 vs. 2008-2020 Are growth stocks overvalued? This chart shows the P/E ratio on growth stocks during the dotcom bubble compared to the period 2008-2020. Image: Alpine Macro
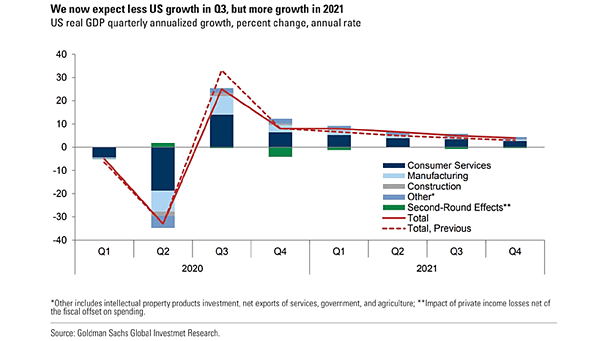
U.S. GDP Growth Forecast Until 2021 Goldman Sachs expects slower U.S. growth in the third quarter, due to the recent increase in coronavirus cases in the United States. Image: Goldman Sachs Global Investment Research
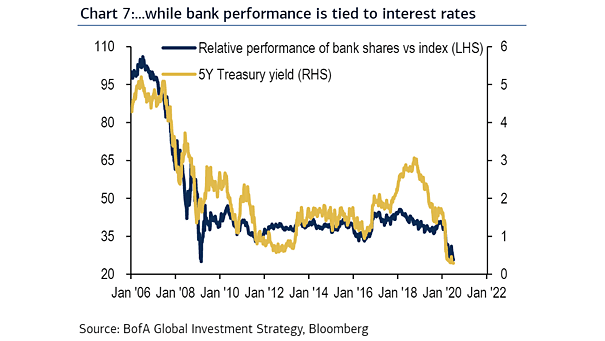
Relative Performance of Bank Shares vs. Index and 5-Year Treasury Yield This chart suggests the relationship between interest rates and relative bank performance. Image: BofA Global Investment Strategy
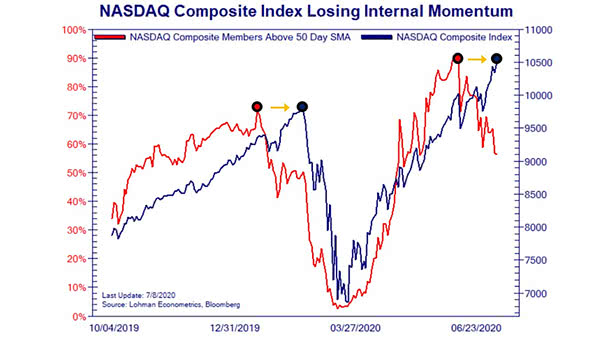
Nasdaq Composite Members Above 50 Day SMA vs. Nasdaq Composite Index Chart suggesting that Nasdaq internals are losing momentum. Image: Lohman Econometrics
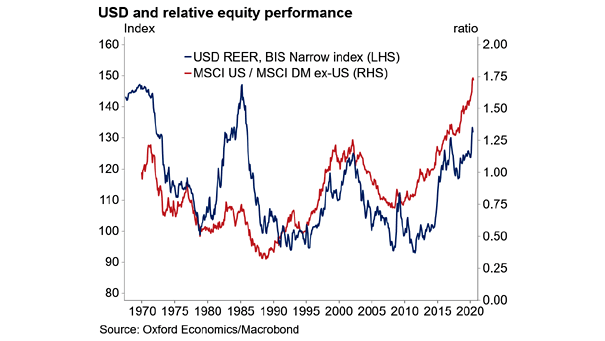
U.S. Dollar and Relative Equity Performance Chart suggesting the pretty close relationship between U.S. dollar cycles and relative equity performance over the last 50 years. Image: Oxford Economics, Macrobond
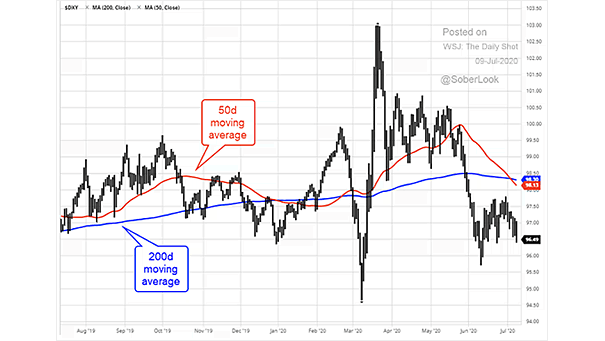
U.S. Dollar and “Death Cross” The “death cross” strikes the U.S. dollar. Image: The Daily Shot
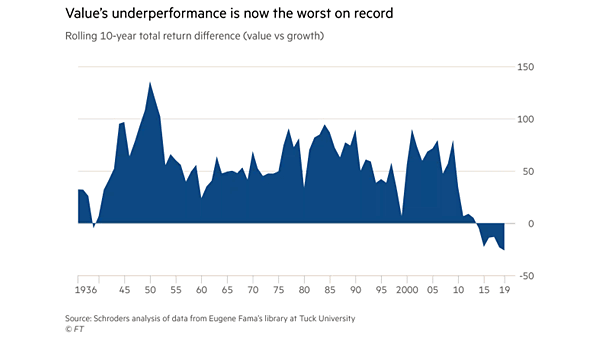
Value vs. Growth – Rolling 10-Year Total Return Will value stocks outperform growth stocks in the recovery phase? Image: Financial Times