Bloomberg Barclays U.S. Treasury Index Total Return
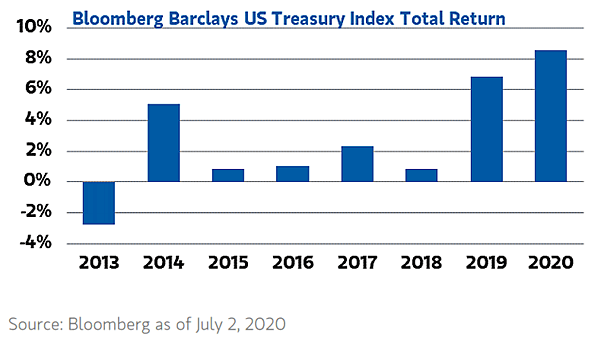
Bloomberg Barclays U.S. Treasury Index Total Return U.S. Treasuries have recorded their strongest performance in the past seven years, thanks to Fed stimulus. Image: Morgan Stanley Research
Bloomberg Barclays U.S. Treasury Index Total Return U.S. Treasuries have recorded their strongest performance in the past seven years, thanks to Fed stimulus. Image: Morgan Stanley Research
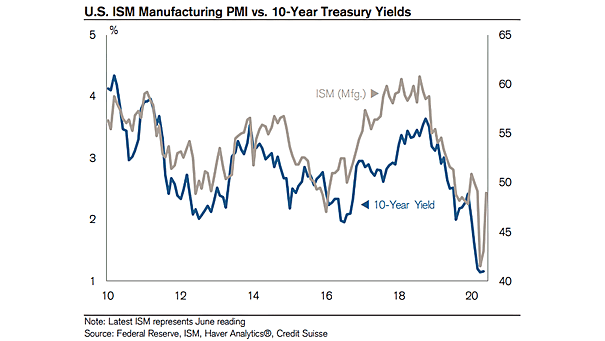
U.S. ISM Manufacturing PMI vs. 10-Year U.S. Treasury Yields 10-year U.S. Treasury yields tend to move with the U.S. ISM Manufacturing PMI. Image: Credit Suisse Research

VIX Futures Bump Around U.S. Election Day Compared with prior cycles, implied volatility for the period around the U.S. election is very high, mainly because of the coronavirus. Image: Goldman Sachs Global Investment Research
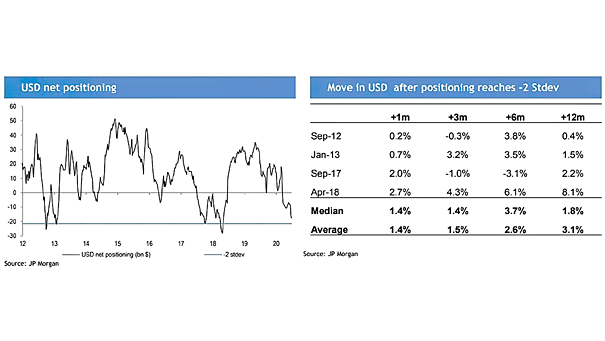
Net U.S. Dollar Positioning When USD postioning is very light, USD tended to move higher. Image: J.P. Morgan
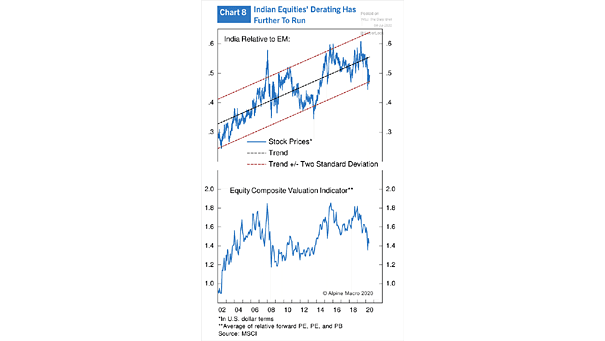
Valuation – Indian Equities Relative to Emerging Market Equities Indian equities lag emerging market peers in recovery. Image: Alpine Macro
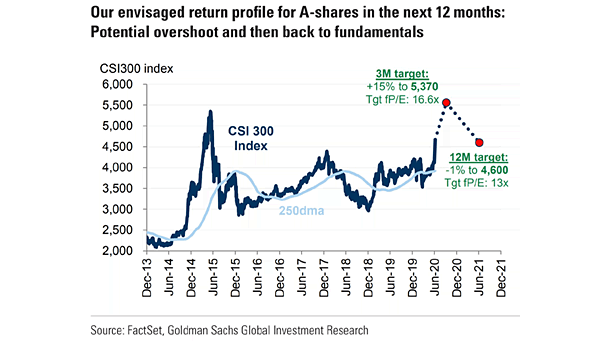
Chinese Stocks – CSI 300 Index Goldman Sachs raises its 12-month CSI300 forecast by 12% to 4,600 from 4,100. Image: Goldman Sachs Global Investment Research
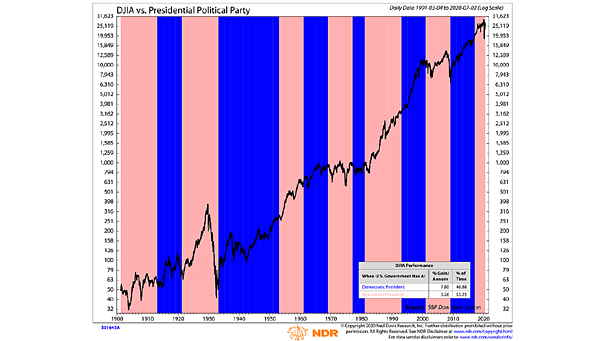
U.S. Elections – Dow Jones vs. Presidential Political Party Republicans vs. Democrats: this chart shows that Dow Jones returns have been much better when a Democrat held the presidency. Image: Ned Davis Research
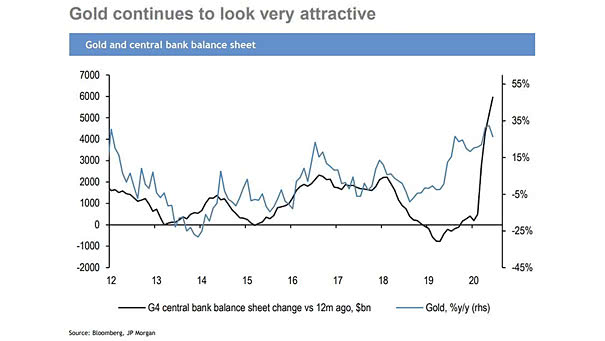
Gold and G4 Central Bank Balance Sheet Chart suggesting that G4 central bank balance sheet expansion is positive for gold. Image: J.P. Morgan
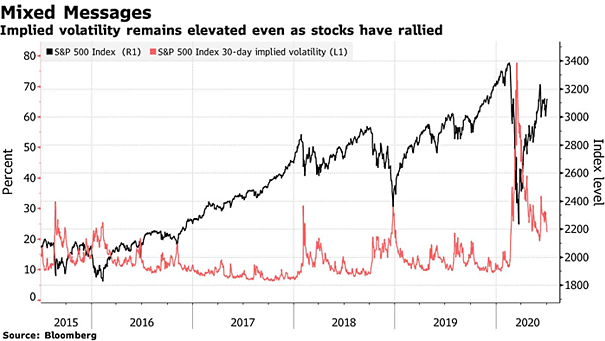
S&P 500 Index vs. S&P 500 Index 30-Day Implied Volatility (VIX) Despite the stock market’s breathtaking rally, volatility remains elevated. Image: Bloomberg
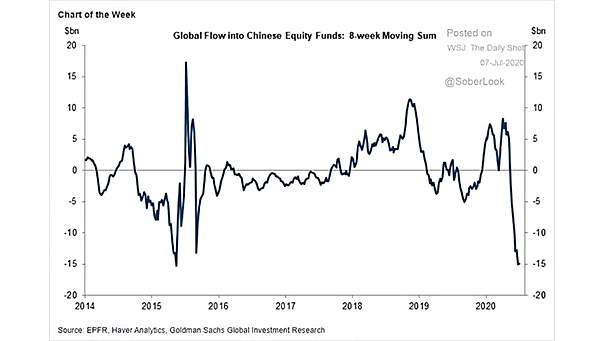
Global Flow into Chinese Equity Funds Chinese equity funds saw an 11th consecutive week of net outflows. Image: Goldman Sachs Global Investment Research
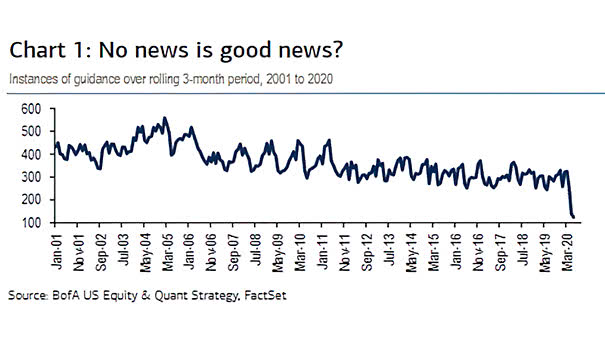
S&P 500 Companies and Profit Guidance Over the last three months, 80% of S&P 500 companies failed to provide guidance. That’s a record going back to 2001. Image: BofA US Equity & Quant Strategy