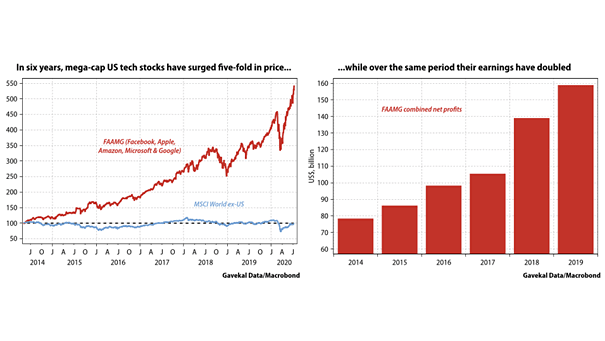
Equity Over-Valuation Composite Indicator
Equity Over-Valuation Composite Indicator Is the current stock market the most overvalued since 1998? 78% of FMS investors think so. Image: BofA Global Fund Manager Survey
China Monthly Economic Indicators China recovery is far from complete, as demand remains weak. Image: Gavekal, Macrobond
Composite PMI Output Index Chart suggesting that the recovery looks V-shaped, so far. Image: Macrobond Financial
S&P 500 Bull/Base/Bear Forecasts for June 2021 Morgan Stanley is bullish, raising its June 2021 S&P 500 target to 3,350 (base case scenario). Image: Morgan Stanley Research
Sentiment Indicators Relative to their 10-Year Range Chart suggesting that investor sentiment and positioning look weak overall. Image: Morgan Stanley Research
Hedge Fund Current Net Exposure to the Equity Markets Hedge fund net exposure to equities is now high relative to recent history. Image: BofA Global Fund Manager Survey
S&P 500 Index Drawdowns After Rally Off Lows After major bear market lows in place, pullbacks are actually perfectly normal. Image: LPL Research
Share of Countries in Recession The global economy plunges into the worst recession since World War II. Image: The Wall Street Journal
Performance – Retail Trading Favorites vs. S&P 500 The most popular retail trading stocks have outperformed sharply the broader market. Image: Goldman Sachs Global Investment Research
Volatility and Number of 3-Sigma Moves This year has seen more extreme cross-asset moves than any year since 1998. Image: Morgan Stanley Research