S&P 500 Futures Market Liquidity
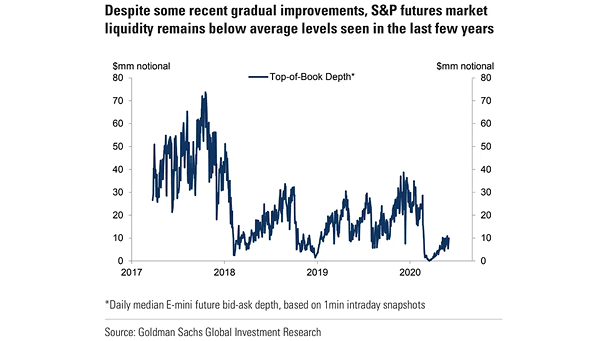
S&P 500 Futures Market Liquidity Liquidity in U.S. equity collapsed in early 2018 and remains at low levels. Lack of liquidity tends to lead to violent market moves. Image: Goldman Sachs Global Investment Research
S&P 500 Futures Market Liquidity Liquidity in U.S. equity collapsed in early 2018 and remains at low levels. Lack of liquidity tends to lead to violent market moves. Image: Goldman Sachs Global Investment Research
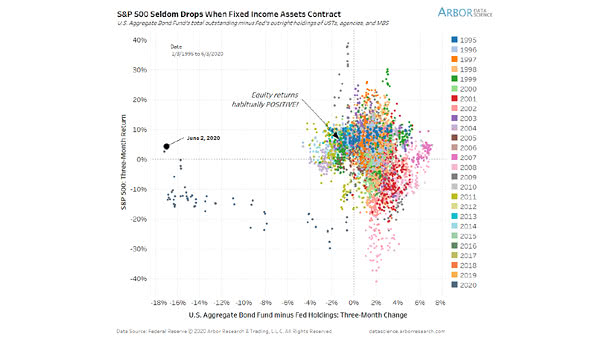
S&P 500 Return and U.S. Aggregate Bond Fund minus Fed Holdings Historically, U.S. equities tend to deliver positive returns when fixed income assets contract. Image: Arbor Research & Trading LLC

Next Twelve Months P/E: Mega-Cap Growth Stocks vs. S&P 500 ex Mega-Cap Growth The outperformance of mega-cap growth stocks is similar with forward multiples. Image: Deutsche Bank Asset Allocation
S&P 500 and Largest 50-Day Gains Ever (Greater than 20%) This was the greatest 50-day rally ever for the S&P 500. Historically, past big rallies saw the S&P 500 higher 6- and 12-months later. Image:…
S&P 500 and % of Stocks Above their 200-Day Moving Average More than 90% of S&P 500 stocks are trading above their 50-day moving average, but just 47% are above their 200-day moving average today.…
Ratio of Mega-Cap Growth Stocks to the Rest of S&P 500 The rise in price of mega-cap growth stocks suggests that the earnings acceleration appears fully priced in. Image: Deutsche Bank Asset Allocation
U.S. Unemployment Rate and Inequality: African Americans vs. Whites This chart highlights the large gap between the African Americans and whites unemployment rates in the United States. Image: Financial Times
Flows – IG Bond Funds/ETFs and Prime Money Market Funds From record outflows to large inflows, the Fed has solved the liquidity crisis so far. Image: BofA Global Research
How Far is Consumer Activity from Normal in the U.S.? This chart suggests that U.S. consumer activity is gradually recovering. Image: Arbor Research & Trading LLC
S&P 500 Max Drawdown in Recession and % of Drawdown Recovered by Recession End The S&P 500 recovery is the second most recovery of all recessions since 1929, even if the current recession ended today.…
Global Recession Could the global recession last a long time? Image: Oxford Economics