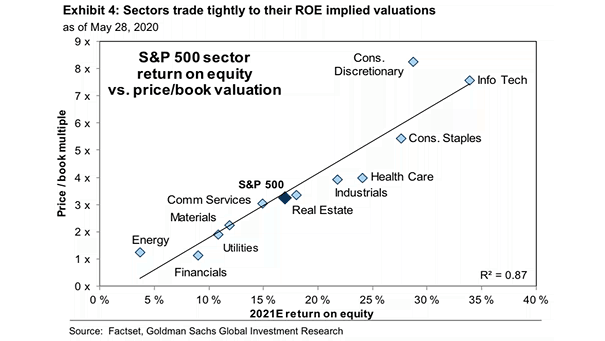
S&P 500 Sectors Announced Buybacks

S&P 500 Sectors Announced Buybacks This chart puts into perspective announced share buybacks by sector in the United States. Image: Deutsche Bank Asset Allocation

Dow Jones to Gold Ratio Since 1800

Dow Jones to Gold Ratio Since 1800 This long-term chart suggests the potential fall in share prices expressed in gold. Image: Incrementum AG

Housing – U.S. Median Famility Income to Mortgage Cost

Housing – U.S. Median Famility Income to Mortgage Cost This chart suggests that relative to family incomes, buying a home in the U.S. is currently quite affordable by historical standards. Image: Gavekal, Macrobond

U.S. Personal Saving Rate

U.S. Personal Saving Rate The personal savings rate soared to 33% in April, as coronavirus causing Americans to accumulate cash. Image: CNBC

S&P 500 and Gold – GWIM Equity Flows and Gold ETF

S&P 500 and Gold – GWIM Equity Flows and Gold ETF Demand for gold remains strong. BofA private clients have been selling S&P 500 at 3000 and buying gold. Image: BofA Global Investment Strategy

Money Supply to GDP vs. Equities and Bonds

Money Supply to GDP vs. Equities and Bonds Historically, when money supply exceeds nominal GDP growth, it tends to be bullish for stocks and bonds. Image: Gavekal, Macrobond