VIX (Volatility) and Implied Equity Risk Premium
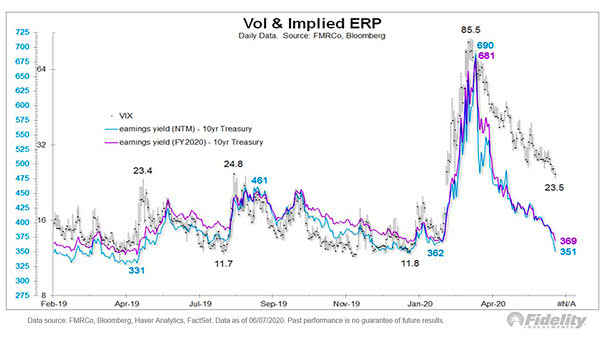
VIX (Volatility) and Implied Equity Risk Premium The risk of a correction is rising, as the implied equity risk premium is now below what the VIX would suggest. Image: Fidelity Investments
VIX (Volatility) and Implied Equity Risk Premium The risk of a correction is rising, as the implied equity risk premium is now below what the VIX would suggest. Image: Fidelity Investments
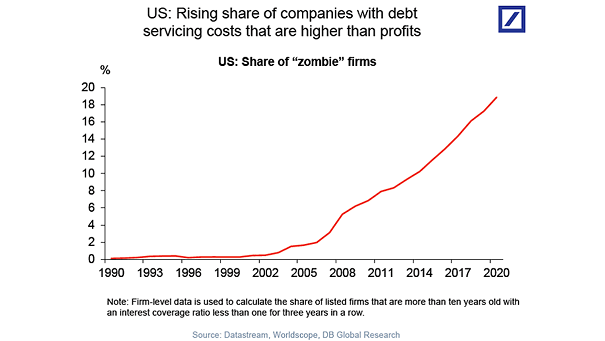
Share of U.S. Zombie Companies The cost of extended monetary easing: low interest rates have created zombie firms. Image: Deutsche Bank Global Research
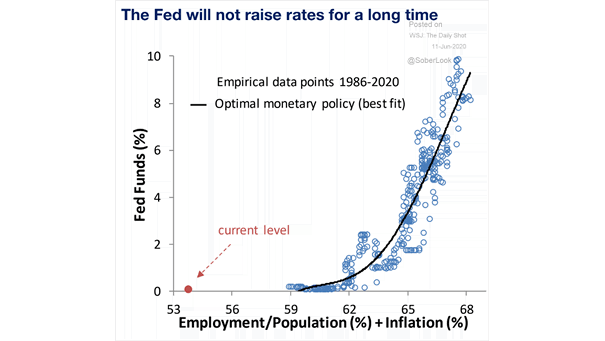
Fed Funds vs. Employment/Population + Inflation This chart suggests the optimal monetary policy, while Fed officials do not anticipate any rate hikes until 2022. Image: Oxford Economics
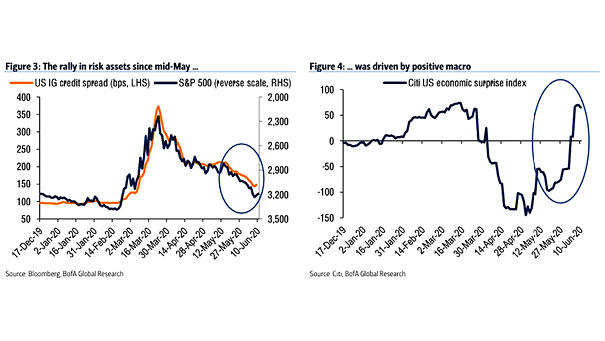
U.S. IG Credit Spread and S&P 500 vs. Citi U.S. Economic Surprise Index Chart suggesting that since mid-May, the rally has been driven by positive macroeconomic factors. Image: BofA Global Research
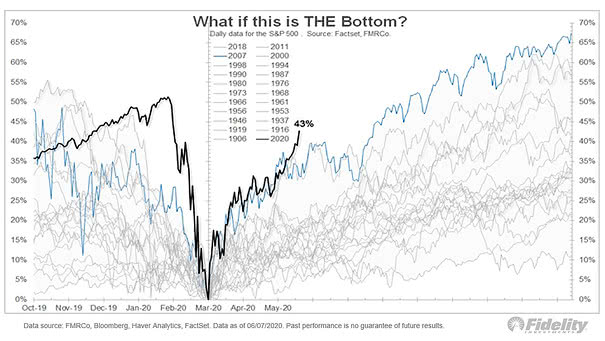
S&P 500 – What If This Is The Bottom? The S&P 500 is currently tracking the 2009 recovery analog. Image: Fidelity Investments
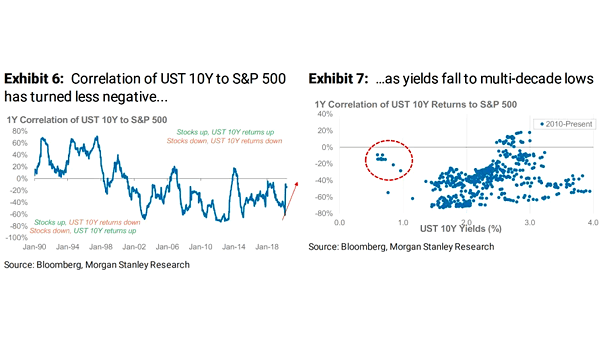
Correlation of U.S. Bonds to S&P 500 The diversification benefit of bonds could be reduced, as the correlation of U.S. bonds to equities has become less negative. Image: Morgan Stanley Research
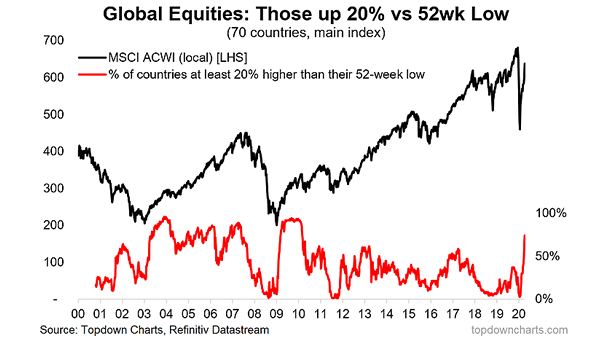
Global Equities: % of Countries at Least 20% Higher than their 52-Week Low A new bull market in global equities? This chart suggests that 74% of countries are now in a “bull market”. Image: Topdown…
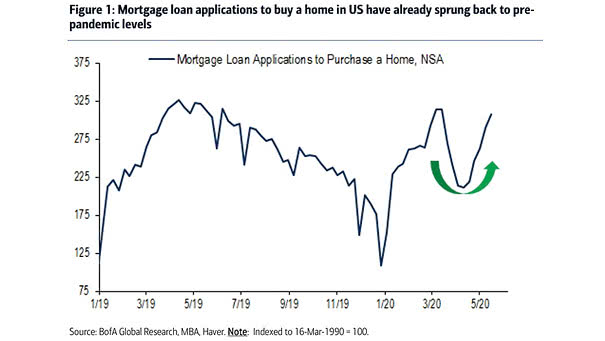
Housing – Mortgage Loan Applications to Purchase a Home in the U.S. Mortgage loan applications to purchase a home in the U.S. are back to pre-pandemic levels. Image: BofA Global Research
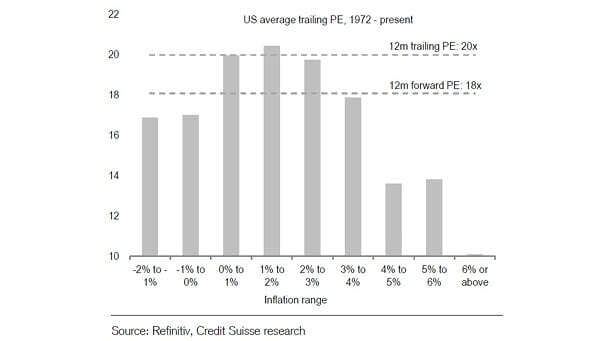
U.S. Average P/E Ratio and Inflation Range This chart suggests that rising inflation is good for P/E until inflation exceeds 3%. Image: Credit Suisse Research
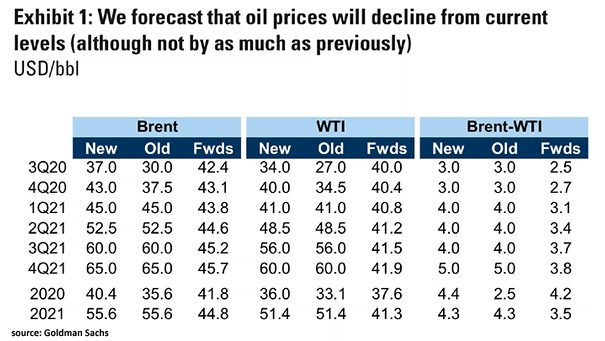
Crude Oil Forecasts Goldman Sachs expects oil prices to decline from current levels. Image: Goldman Sachs Global Investment Research
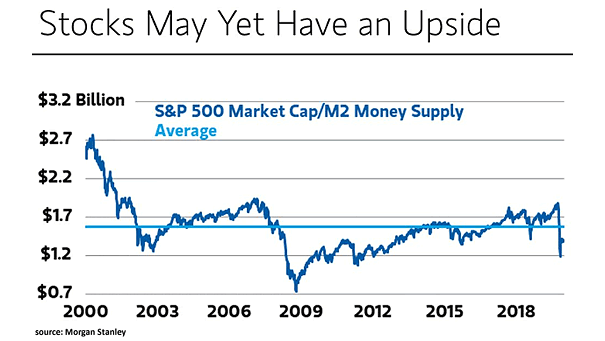
S&P 500 Market Cap/M2 Money Supply The S&P 500 market capitalization relative to M2 money supply suggests more upside. Image: Morgan Stanley Research