Job Losses During Recessions in the U.S.
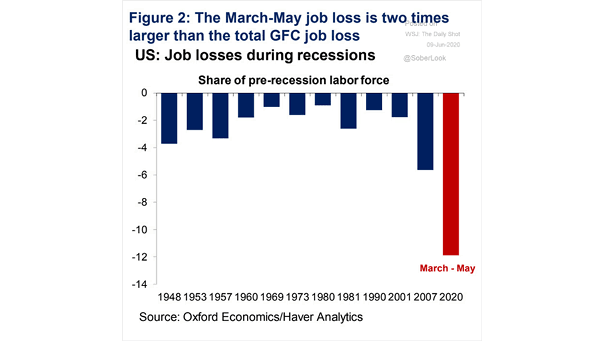
Job Losses During Recessions in the U.S. The March-May job loss is two times larger than the total GFC job loss. On the positive side, U.S. job losses see revival in May. Image: Oxford Economics
Job Losses During Recessions in the U.S. The March-May job loss is two times larger than the total GFC job loss. On the positive side, U.S. job losses see revival in May. Image: Oxford Economics
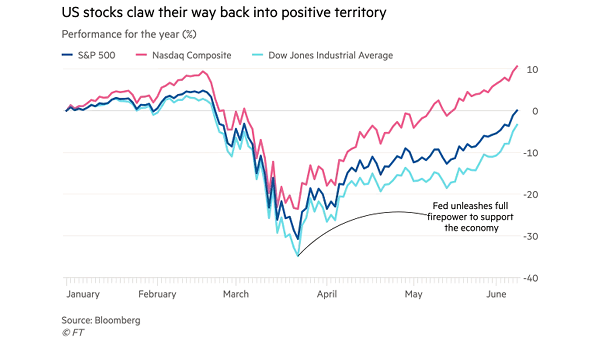
Performance for the Year: S&P 500, Nasdaq Composite and Dow Jones Industrial Average U.S. stocks climbed, erasing 2020 losses, as easing lockdowns boosts risk appetite. Image: Financial Times
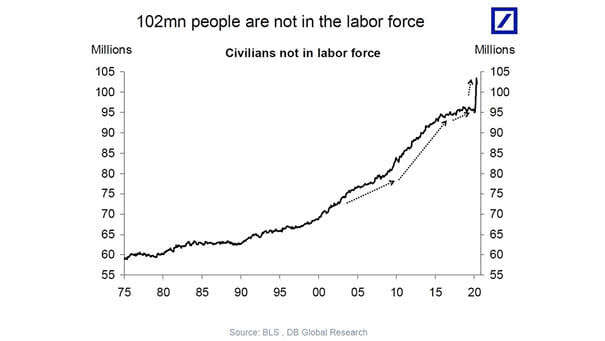
U.S. Civilians Not In Labor Force To put things into perspective, there currently about 137 million employed workers in the United States, and 102 million Americans are not in the labor force. Image: Deutsche Bank…
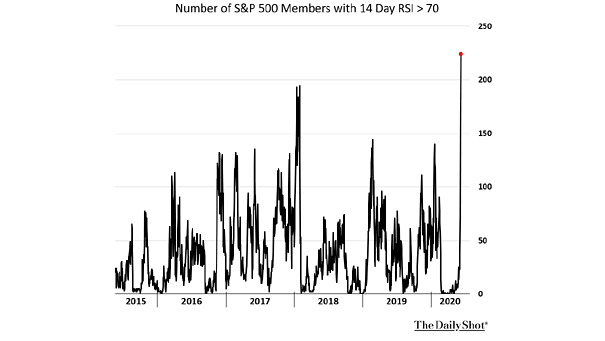
Valuation – Number of S&P 500 Members with 14 Day RSI Above 70 Market complacency is high, as the RSI level is getting into overbought condition for many S&P 500 stocks. Image: The Daily Shot
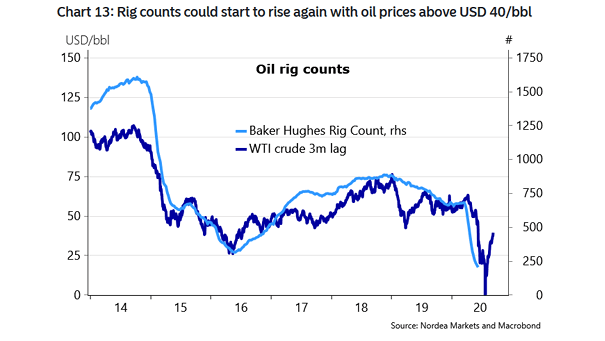
Oil Rig Counts and WTI Crude Oil Price (Leading Indicator) Oil price is impacting drilling activity. WTI crude oil price tends to lead oil rig counts by three months. Image: Nordea and Macrobond
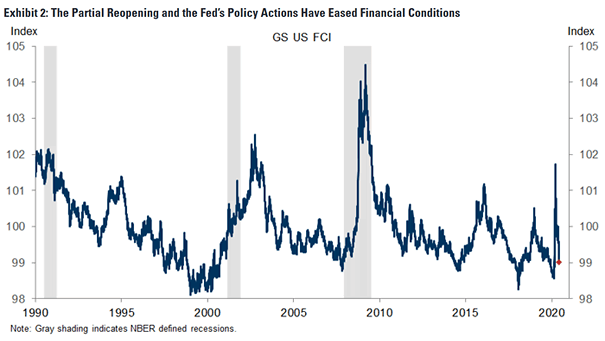
U.S. Financial Conditions U.S. financial conditions are easing at fastest pace since 1990, thanks to policy stimulus. Image: Goldman Sachs Global Investment Research
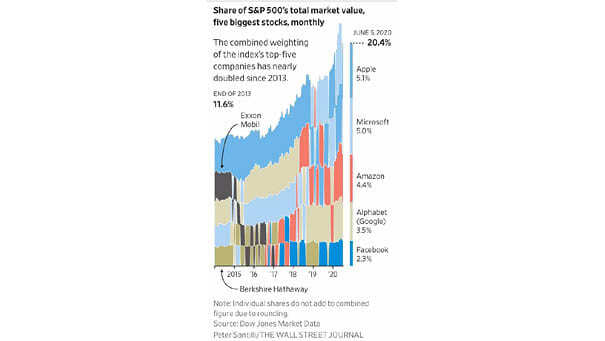
Share of S&P 500’s Total Market Value, Five Biggest Stocks The market capitalization of the five largest companies now accounts for 20.4% of S&P 500 total and has nearly doubled since 2013. Image: The Wall…
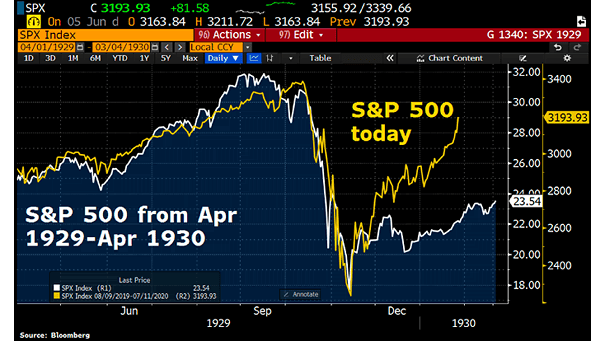
S&P 500 Today vs. S&P 500 1929-1930 This chart compares the S&P 500 today vs. 1929-30. Have some investors underestimated how far the Fed would go? Image: Bloomberg
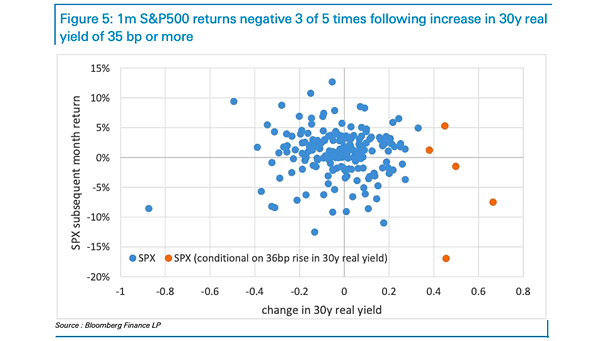
S&P 500 Subsequent Month Return and Change in 30-Year Real Yield When 30-year real yields rose as much as today, S&P 500 returns the following month were negative 3 times out of 5. Image: Deutsche…
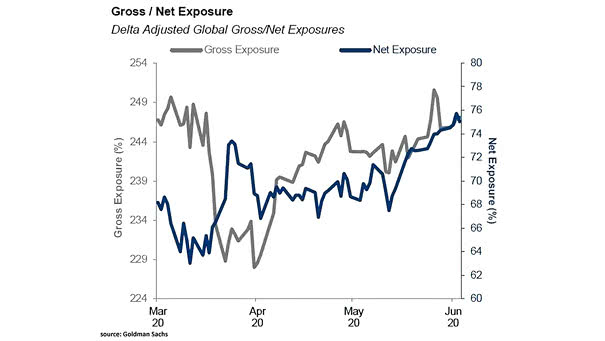
Hedge Fund Gross / Net Exposure (Leverage) Hedge fund net exposure rose to 75%. This is the highest level in over two years. Image: Goldman Sachs Global Investment Research
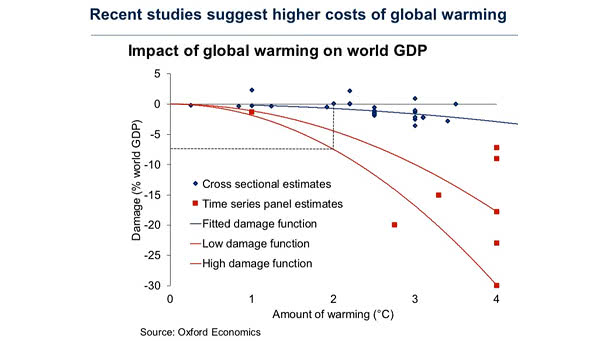
Impact of Global Warming on World GDP (CO2 Emission) This chart suggests the impact of global warming on world GDP. Image: Oxford Economics