How Far is Consumer Activity from Normal in the U.S.?
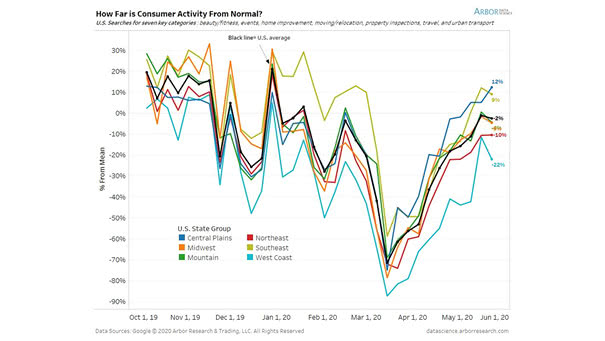
How Far is Consumer Activity from Normal in the U.S.? This chart suggests that U.S. consumer activity is gradually recovering. Image: Arbor Research & Trading LLC
How Far is Consumer Activity from Normal in the U.S.? This chart suggests that U.S. consumer activity is gradually recovering. Image: Arbor Research & Trading LLC
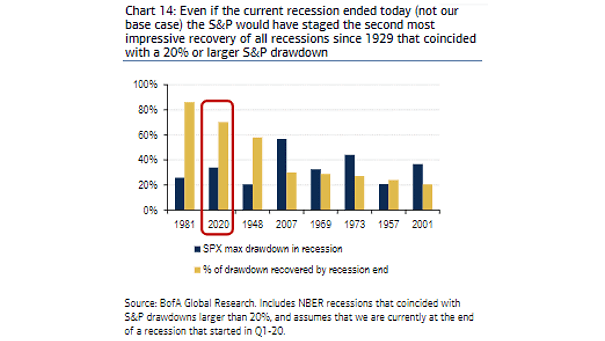
S&P 500 Max Drawdown in Recession and % of Drawdown Recovered by Recession End The S&P 500 recovery is the second most recovery of all recessions since 1929, even if the current recession ended today.…
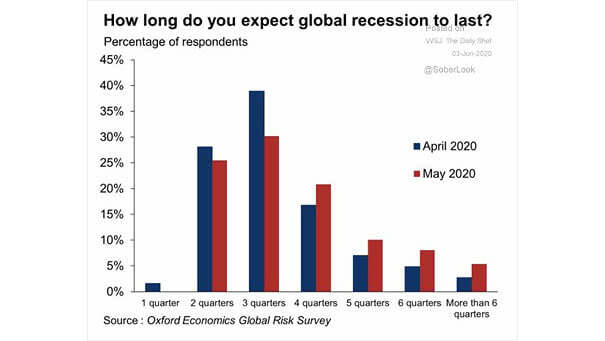
Global Recession Could the global recession last a long time? Image: Oxford Economics
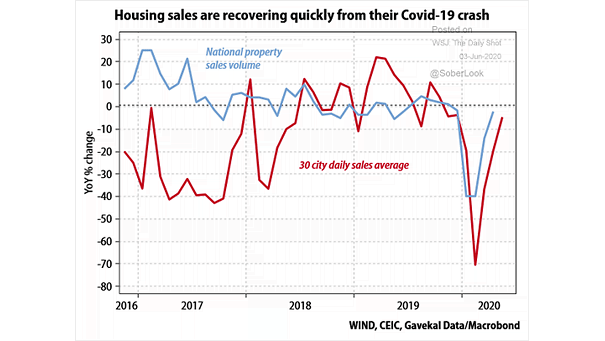
U.S. Housing Sales U.S. housing sales are recovering from coronavirus, as builders have been reporting stronger demand. Image: Gavekal, Macrobond
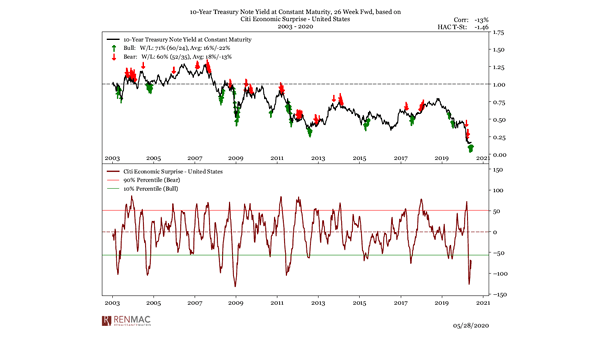
Citi Economic Surprise Index and 10-Year Treasury Note Yield Are bonds risky? The Citi Economic Surprise Index suggests that bond yields could rise. Image: Renaissance Macro Research
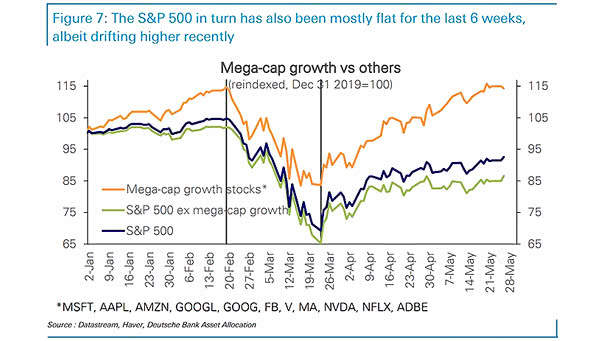
Mega-Cap Growth Stocks vs. S&P 500 This chart highlights the outperformance YTD of mega-cap growth stocks vs. the S&P 500. Image: Deutsche Bank Asset Allocation
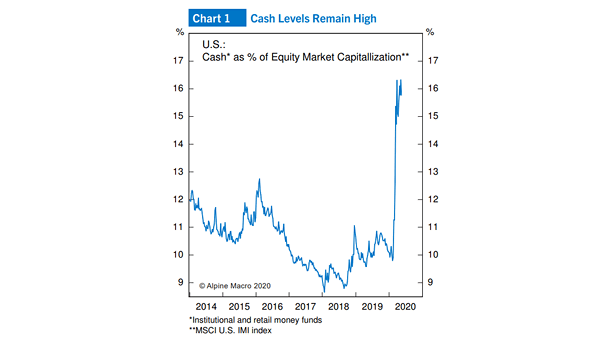
Cash as % of U.S. Equity Market Capitalization Investors are confused, as there is a lot of cash on the sideline, despite the market rally. Image: Alpine Macro
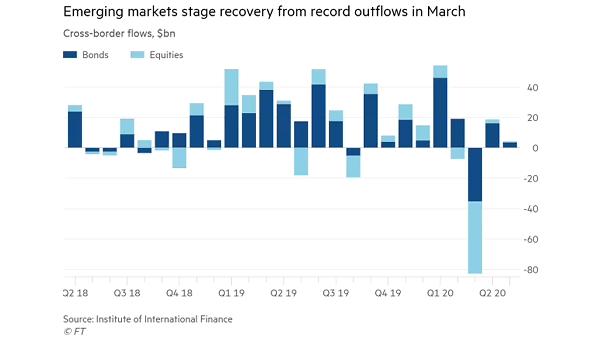
Emerging Markets – Cross-Border Flows Chart showing the revival of emerging market equities and bonds from record outflows in March. Image: Financial Times
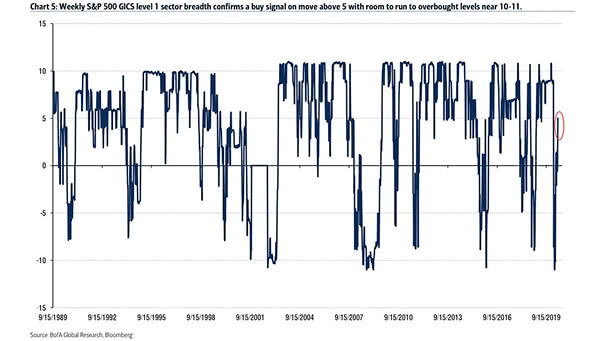
Weekly S&P 500 GICS Level 1 Sector Breadth This bullish chart shows that the S&P 500 GICs level 1 sector breadth moved above five, confirming the 2020 market rally. Image: BofA Global Research
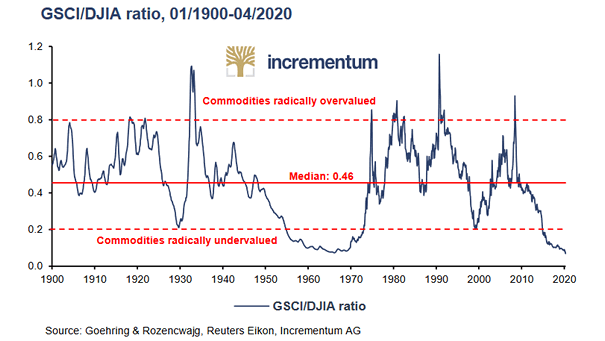
Valuation – Commodities Relative to the Dow Jones Commodities relative to the Dow Jones are trading at the lowest valuation level since the mid-1960s. Image: Incrementum
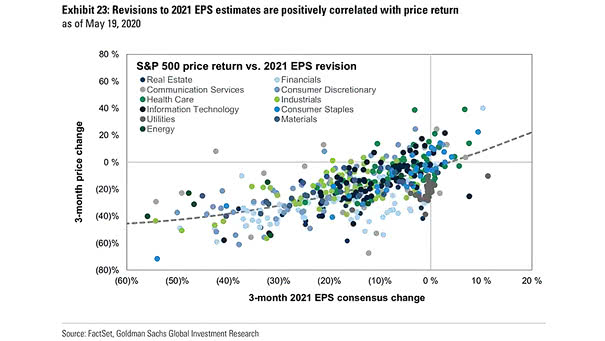
S&P 500 Price Return vs. 2021 EPS Revisions This chart highlights the positive correlation between price return and 2021 earnings revisions. Image: Goldman Sachs Global Investment Research