U.S. Stock Value (HML) Drawdowns
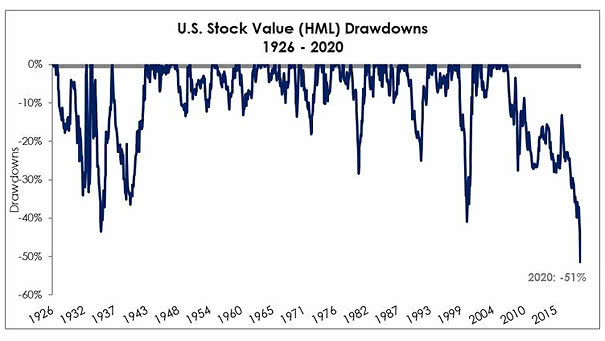
U.S. Stock Value (HML) Drawdowns Is traditional value investing dead? Value factor is down -51% from the peak. Image: Professor Kenneth R. French
U.S. Stock Value (HML) Drawdowns Is traditional value investing dead? Value factor is down -51% from the peak. Image: Professor Kenneth R. French
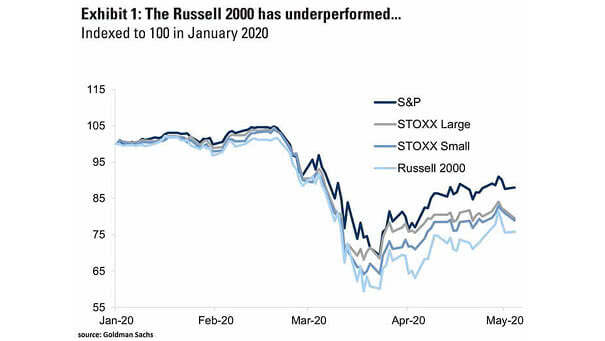
S&P 500 vs. Russell 2000 The Russell 2000 has underperformed recently. Tech accounts for 25% of the S&P 500 vs. 15% of the Russell 2000. Image: Goldman Sachs Global Investment Research
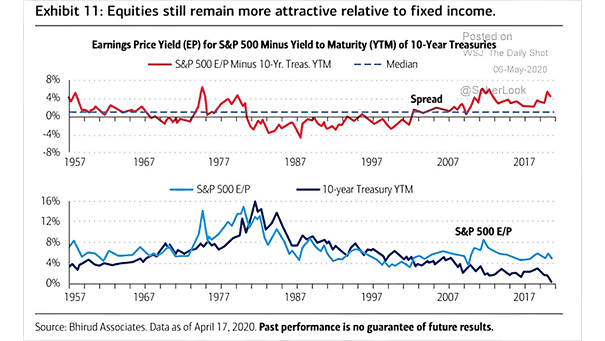
Earnings Price Yield for S&P 500 Minus Maturity of 10-Year Treasuries This chart suggests that equities are more attractive relative to fixed income. But the equity risk does not disappear because the spread (earnings yield minus…
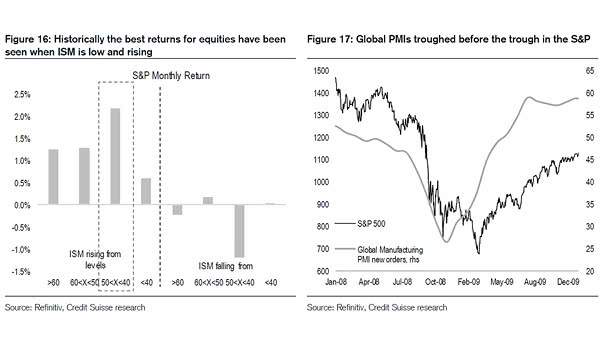
ISM PMI and S&P 500 Monthly Return Historically, the best returns for the S&P 500 have been seen when ISM is low and rising. Image: Credit Suisse Research
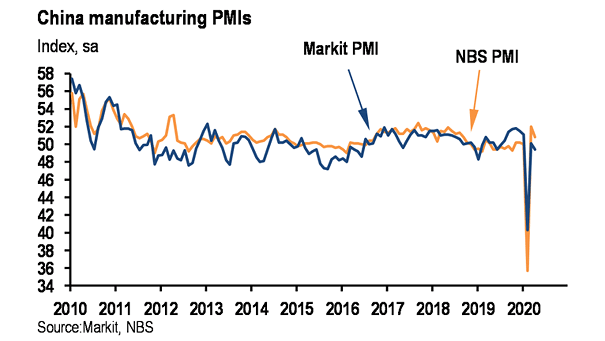
China Manufacturing PMI China Manufacturing PMIs suggest ongoing recovery, after a deep contraction in the first quarter. Image: J.P. Morgan
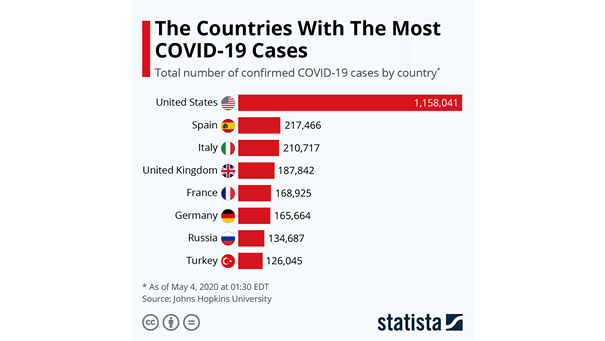
Total Number of Confirmed Coronavirus Cases by Country The United States has a total of more than one million cases of COVID-19. Image: Statista
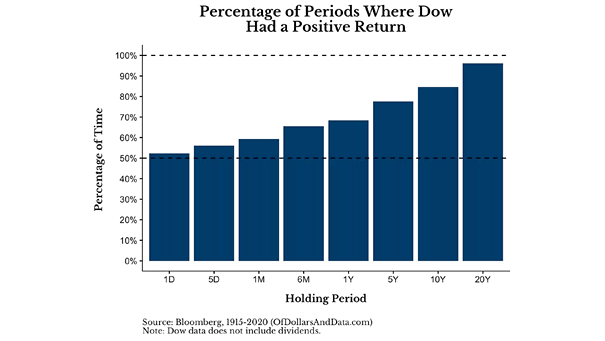
Percentage of Periods Where the Dow Jones Had a Positive Return The probability of a positive return converges towards 100% over a long period of time. Image: Of Dollars And Data
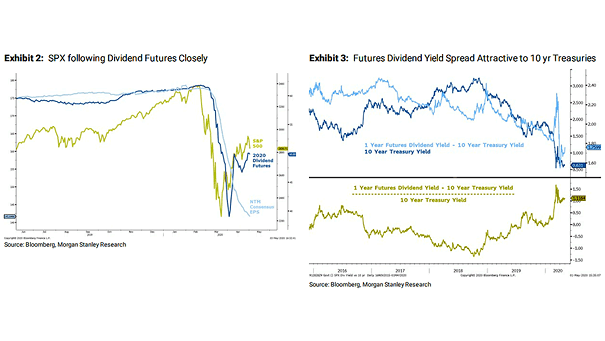
S&P 500 and Dividend Futures This chart suggests that the S&P 500 does appear to be trading off dividend forecasts more than earnings. Image: Morgan Stanley Research
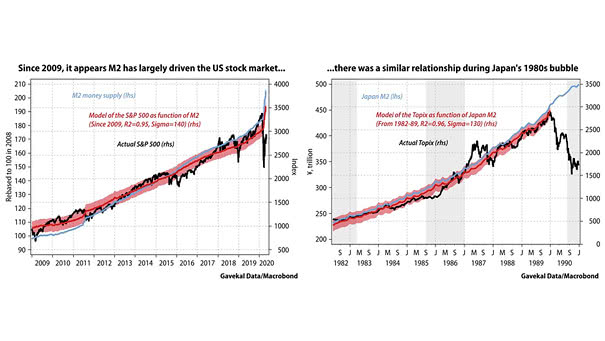
M2 Money Supply and S&P 500 vs. Japan M2 and Topix M2 is rising significantly in the U.S., as during the Japanese bubble market of the 1980s. Image: Gavekal, Macrobond
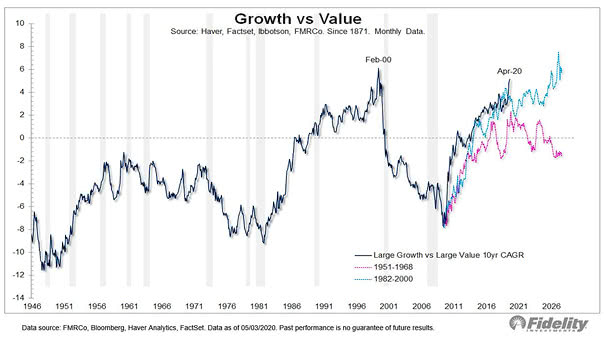
Large Growth Stocks vs. Large Value Stocks Growth vs. value is back to the internet bubble peak. Image: Fidelity Investments
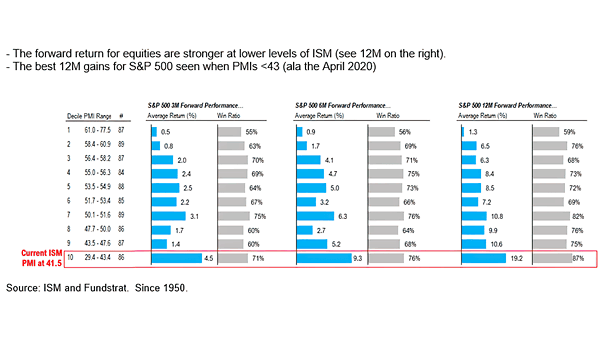
ISM PMI Since 1950 and S&P 500 Forward Performance Historically, the S&P 500 forward performance is better when the ISM PMI is below 43. Image: Fundstrat Global Advisors, LLC