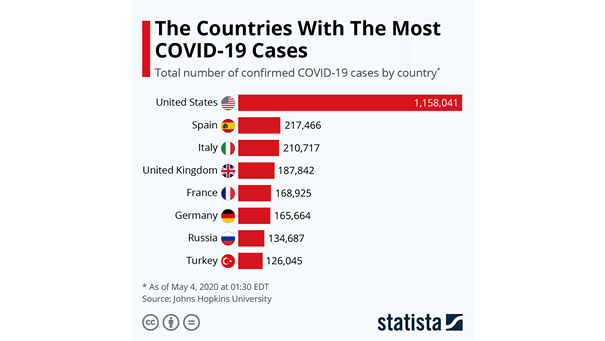
Total Number of Confirmed Coronavirus Cases by Country
Total Number of Confirmed Coronavirus Cases by Country The United States has a total of more than one million cases of COVID-19. Image: Statista
Total Number of Confirmed Coronavirus Cases by Country The United States has a total of more than one million cases of COVID-19. Image: Statista
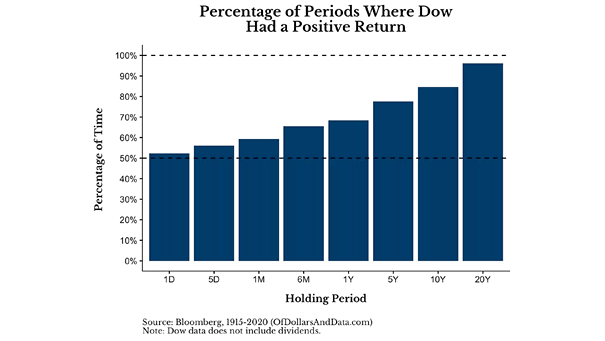
Percentage of Periods Where the Dow Jones Had a Positive Return The probability of a positive return converges towards 100% over a long period of time. Image: Of Dollars And Data
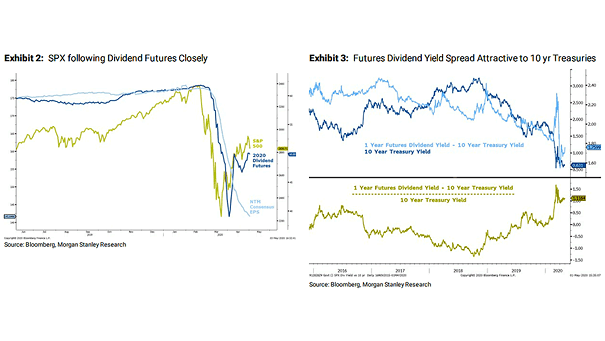
S&P 500 and Dividend Futures This chart suggests that the S&P 500 does appear to be trading off dividend forecasts more than earnings. Image: Morgan Stanley Research
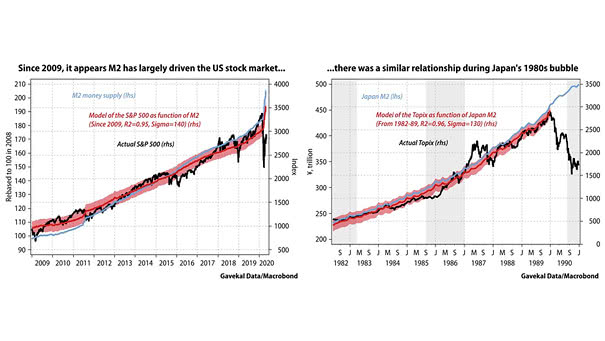
M2 Money Supply and S&P 500 vs. Japan M2 and Topix M2 is rising significantly in the U.S., as during the Japanese bubble market of the 1980s. Image: Gavekal, Macrobond
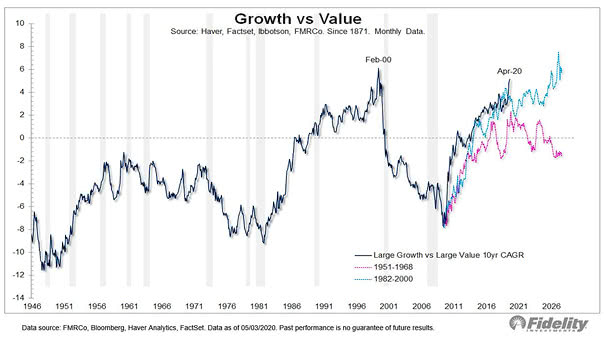
Large Growth Stocks vs. Large Value Stocks Growth vs. value is back to the internet bubble peak. Image: Fidelity Investments
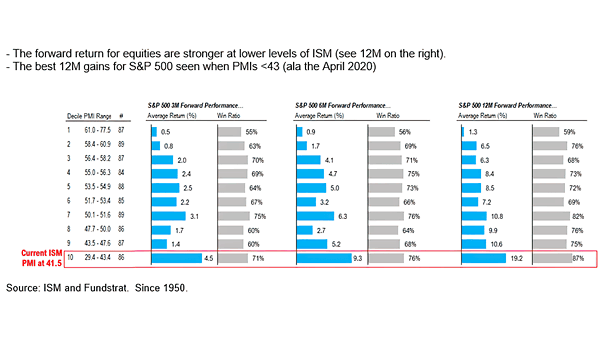
ISM PMI Since 1950 and S&P 500 Forward Performance Historically, the S&P 500 forward performance is better when the ISM PMI is below 43. Image: Fundstrat Global Advisors, LLC
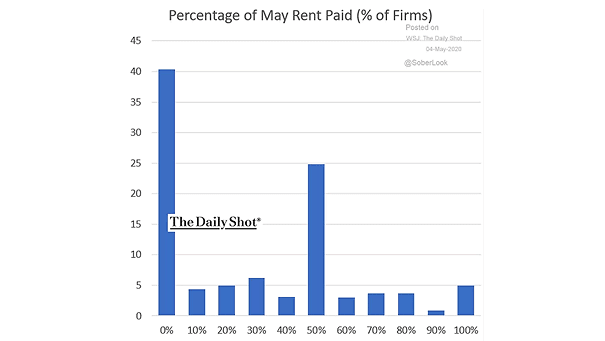
Small Business and Percentage of May Rent Paid Rent poses small business challenge, as 40% of US small businesses are skipping rent this month. Image: The Daily Shot
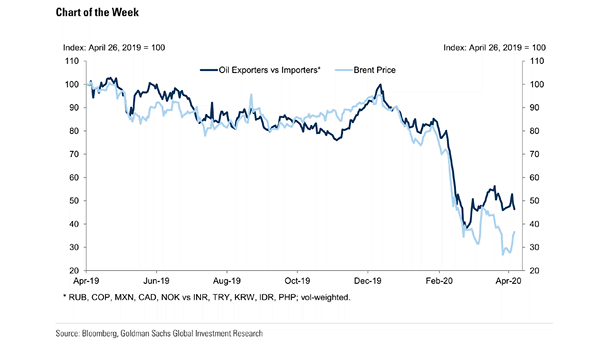
Oil Exporters vs. Importers and Brent Price This chart shows the good correlation between oil exporters vs. importers and the price of Brent. Image: Goldman Sachs Global Investment Research
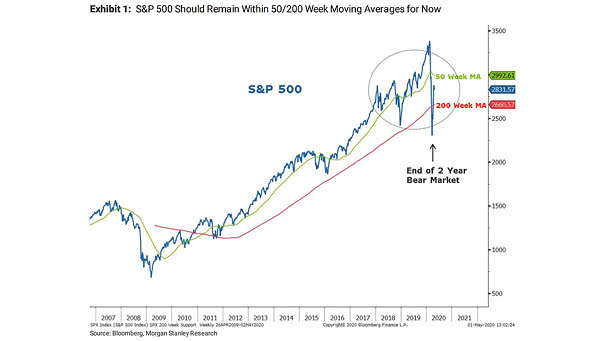
S&P 500 and End of Two Year Bear Market This chart suggests that the 200-week moving average will be defended, as the two-year bear market ended in March. Image: Morgan Stanley Research
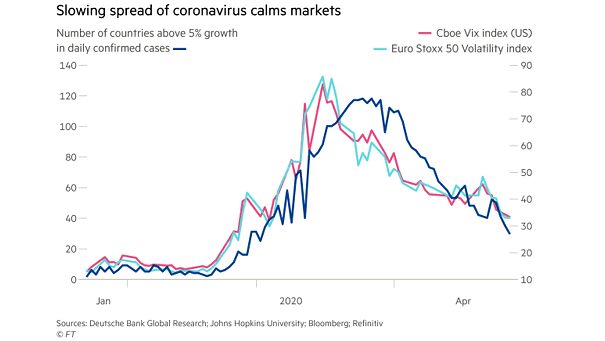
Growth in New Coronavirus Cases vs. Euro Stoxx 50 Volatility Index and VIX As the coronavirus pandemic is slowing down, volatility is going away. Image: Financial Times
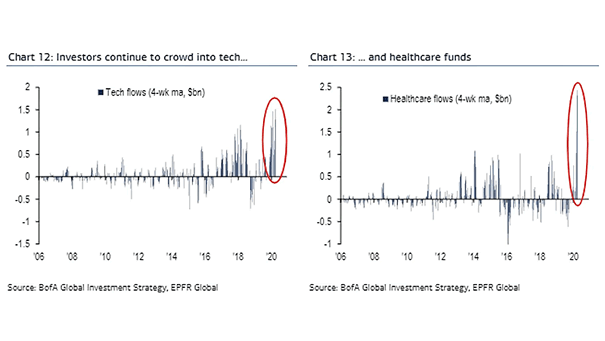
Tech and Healthcare Flows Where the money is flowing? Into tech and healthcare funds, so far. Image: BofA Global Investment Strategy