Risk of Small Business Closure
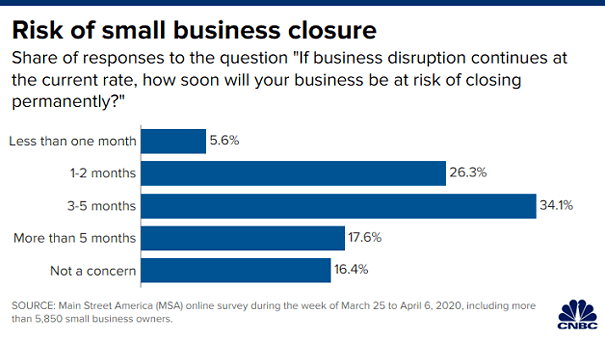
Risk of Small Business Closure More than 30% of US small businesses are at risk, if business disruption caused by the coronavirus pandemic persists for two months. Image: CNBC
Risk of Small Business Closure More than 30% of US small businesses are at risk, if business disruption caused by the coronavirus pandemic persists for two months. Image: CNBC
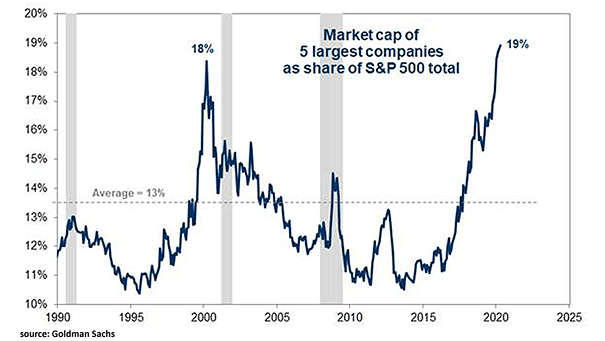
Market Capitalization of 5 Largest Companies as Share of S&P 500 Total The market capitalization of the five largest companies now account for 19% of S&P 500 total, while the average is 13%. Image: Goldman…
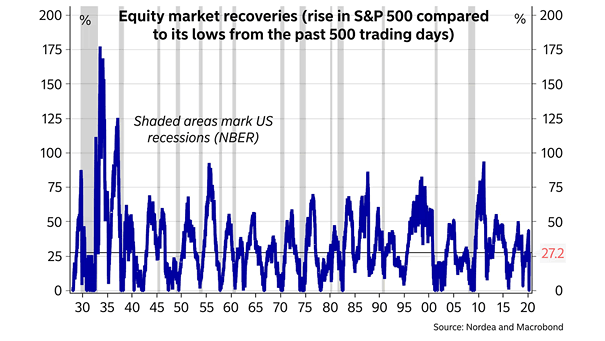
Equity Market Recoveries (Rise in S&P 500 Compared to Its Lows from the Past 500 Trading Days) Historically, the S&P 500 has rallied at least another 10% following a major crash. Image: Nordea and Macrobond
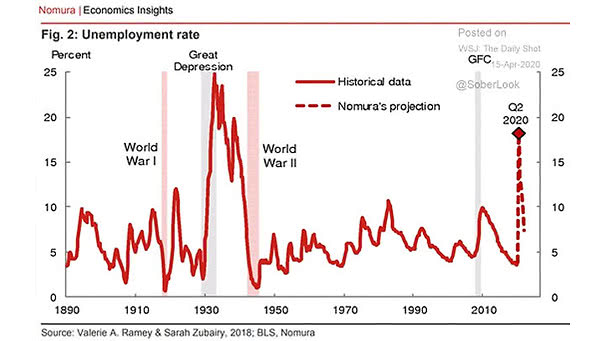
U.S. Unemployment Rate Projection This chart shows the Nomura’s forecast for US unemployment. Image: Nomura
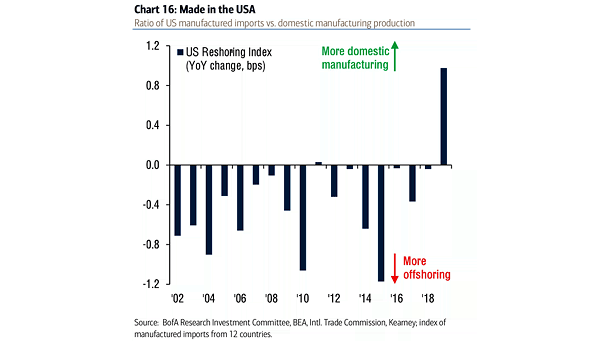
Ratio of U.S. Manufactured Imports vs. Domestic Manufacturing Production This chart shows that there’s been an extraordinary resurgence of American manufacturing for the past several years. Image: BofA Research Investment Committee
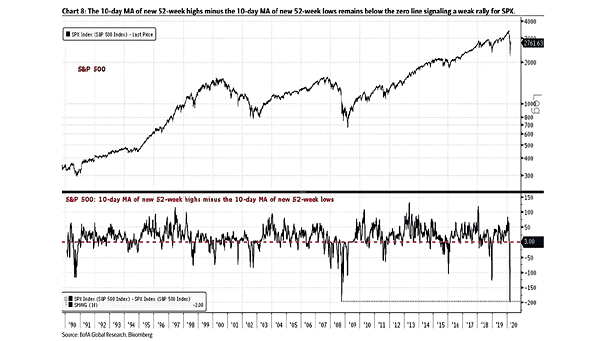
Bear Market Rally – 10-Day MA of New 52-Week Highs Minus 10-Day MA of New 52-Week Lows The 10-day MA of new 52-week highs minus 10-day MA of new 52-week lows suggests a week rally…
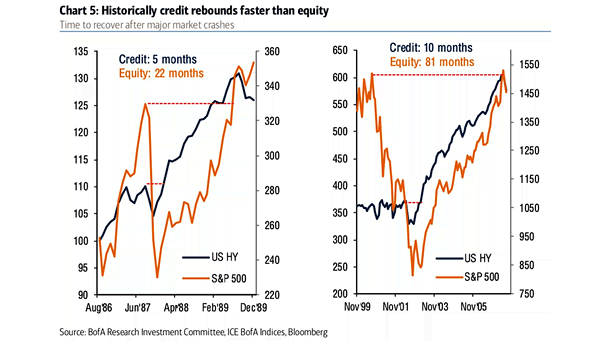
U.S. High Yield vs. S&P 500 and Time to Recover After Major Market Crashes Historically, credit has recovered faster than equity after major market crashes. Image: BofA Research Investment Committee
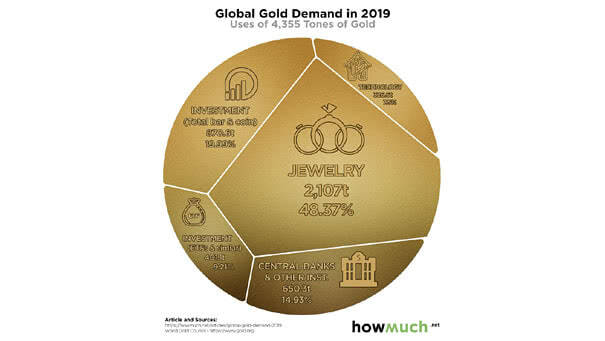
Global Gold Demand This chart shows the largest sources of annual global gold demand. Image: howmuch.net
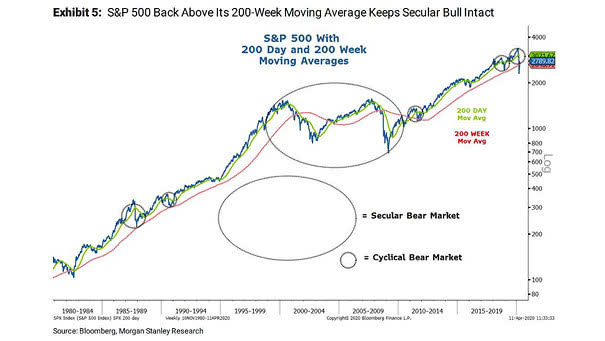
Secular Bull Market – S&P 500 with 200-Day and 200-Week Moving Averages This chart suggests that the secular bull market is intact, as the 200-week moving average is a strong support level. Image: Morgan Stanley…
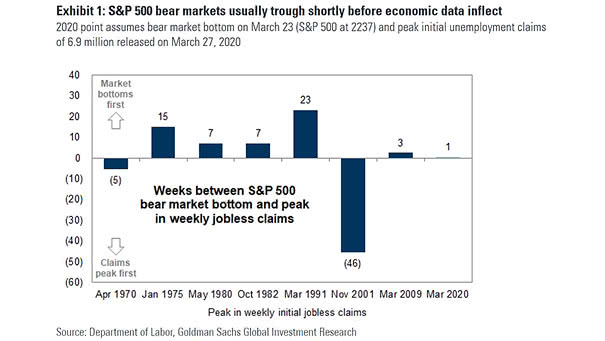
Weeks Between S&P 500 Bear Market Bottom and Peak in Weekly Jobless Claims S&P 500 bear markets usually bottom several weeks before the peak in jobless claims. Image: Goldman Sachs Global Investment Research
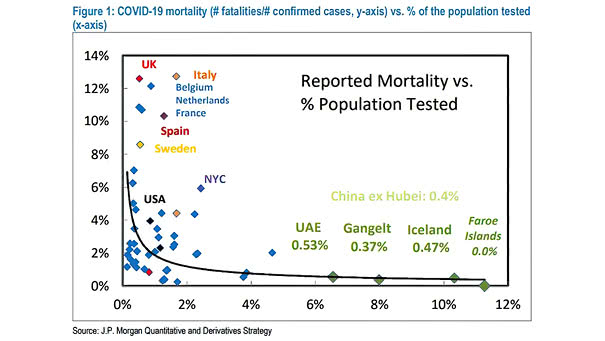
Coronavirus Mortality vs. % of the Population Tested This chart suggests that the true COVID-19 mortality rate could be much lower than originally thought, about 0.4%. Image: J.P. Morgan Quantitative and Derivative Strategy