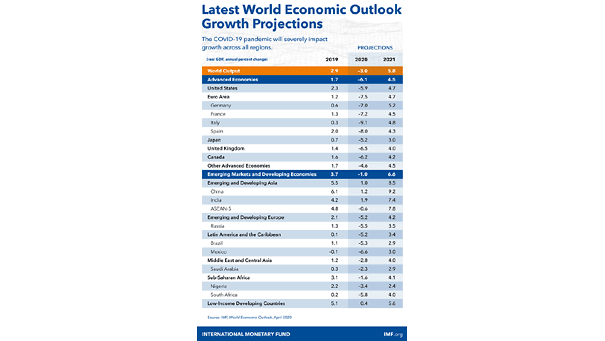
Estimated Contraction in Global Oil Demand by Product

Estimated Contraction in Global Oil Demand by Product Global oil demand is expected to see its first quarterly contraction in over a decade, due to the coronavirus pandemic. Image: J.P. Morgan Commodities Research

S&P 500 – Equity Risk Premium

S&P 500 – Equity Risk Premium This chart suggests that the S&P 500 looks attractive relative to bonds. Image: Truist

Equity Returns Over the Past Decade

Equity Returns Over the Past Decade Goldman Sachs Private Wealth Management is advising its wealthy clients to get back into equities and favor U.S. stocks (for informational purpose only, not a recommendation). Image: Bloomberg

S&P 500 and Earnings Revisions

S&P 500 and Earnings Revisions In recent history, the S&P 500 has bottomed when the second derivative of earnings revisions have bottomed. Image: UBS

S&P 500 Selloffs and Recession Duration

S&P 500 Selloffs and Recession Duration This chart shows the correlation between the duration of recessions and the severity of S&P 500 selloffs (R² = 0.69). Image: BofA Global Research

S&P 500 Average Daily Percentage Move: 1928-2020

S&P 500 Average Daily Percentage Move: 1928-2020 The volatility has been unusual over the last five weeks, as the S&P 500’s average absolute daily percentage change has been +/-4.8%. Image: Bespoke Investment Group