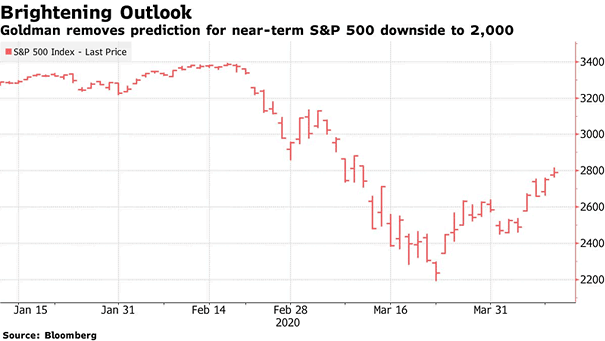
S&P 500 Total Return, 24 Months After Bear Markets
S&P 500 Total Return, 24 Months After Bear Markets This chart puts into perspective the S&P 500 Total Return, 24 months after bear markets. Image: BofA Research Investment Committee
Fiscal Policy – Discretionary Fiscal Easing in Response to Coronavirus Crisis This chart puts into perspective the U.S. fiscal stimulus relative to other countries. Image: Goldman Sachs Global Investment Research
Inflation-Adjusted Investment in U.S. Stock Market This chart puts into perspective the long-term trend of the S&P 500 Total Return adjusted for CPI inflation (real CAGR = 6.7%). Image: Hondo Tomasz
Percentage of NYSE Stocks Above 200-Day Moving Averages The percentage of NYSE stocks above 200-day MAs is below 10% and as oversold as it was in 2008-2009, 1987 and 1974. Image: BofA Global Research
S&P 500 Earnings Estimate Progression The market doesn’t believe that the long term earnings power has changed and expects a V-shaped earnings recovery. Image: Fidelity Investments
Market Sentiment Indicators Most market sentiment indicators are still at low levels. Image: Goldman Sachs Global Investment Research
U.S. and Euro Area GDP Loss and Deficit to GDP The peak-to-trough decline in U.S. and EA GDP is expected to be more than twice as large as during the global financial crisis. Image: Deutsche…
U.S. Fiscal Stimulus and Deficit This chart suggests that the fiscal stimulus will amount to 18% of GDP in 2020 and 11% next year. Image: Goldman Sachs Global Investment Research
Federal Reserve’s Balance Sheet The Federal Reserve’s balance sheet could exceed US$ 9 trillion at the end of 2020, equivalent to more than 40% of US GDP. Image: Financial Times
Quarterly Dollar Notional Amounts of Bonds Downgraded from IG to HY The pace of rating downgrades has accelerated markedly in recent months. Image: Goldman Sachs Global Investment Research
S&P 500 Quarterly Drawdowns of 20% or More Since 1928, a 20%+ down quarter has coincided with major lows five out of eight times. Image: BofA Global Research