U.S. Inflation – Probability Headline CPI Exceeds 2.0% YoY
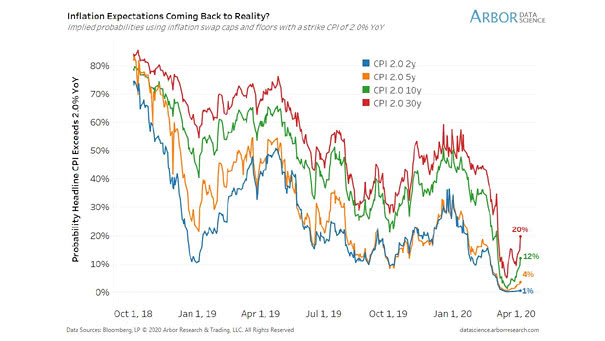
U.S. Inflation – Probability Headline CPI Exceeds 2.0% YoY U.S. inflation expectations are rebounding for the first time this year. Image: Arbor Research & Trading LLC
U.S. Inflation – Probability Headline CPI Exceeds 2.0% YoY U.S. inflation expectations are rebounding for the first time this year. Image: Arbor Research & Trading LLC
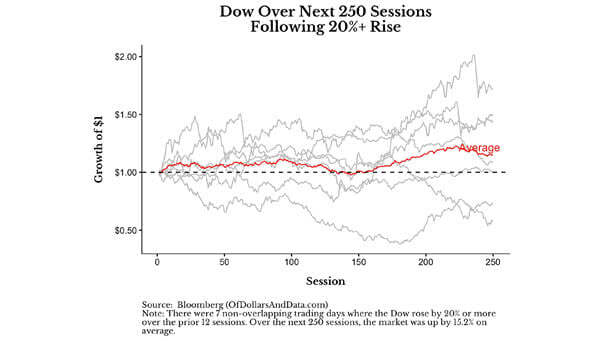
Dow Jones Over Next 250 Sessions Following 20%+ Rise Following a 20%+ rally, the Dow Jones was up by 15.2% on average over the next 250 sessions (one year). Image: Of Dollars And Data
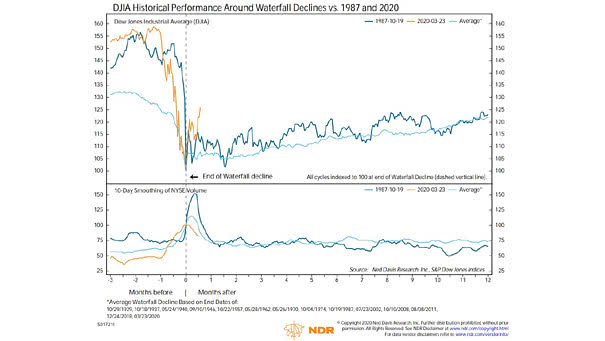
Dow Jones Industrial Average Historical Performance Around Waterfall Declines vs. 1987 and 2020 The current Dow Jones rally is stronger than the 1987 bounce. Image: Ned Davis Research
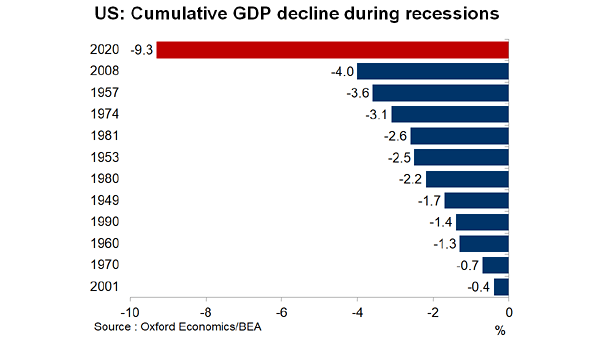
Cumulative U.S. GDP Decline During Recessions Chart suggesting a contraction in U.S. real GDP of more than 9% from peak to trough this year. Image: Oxford Economics
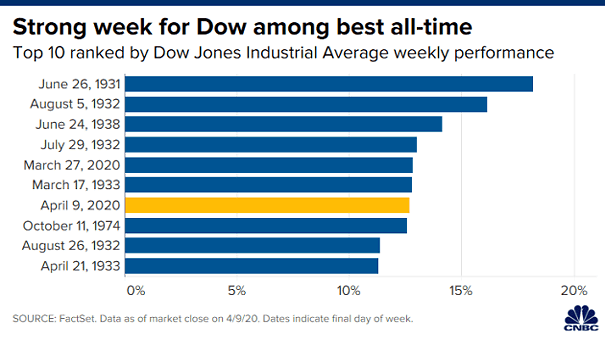
Top 10 Ranked by Dow Jones Industrial Average Weekly Performance For the week, the Dow Jones Industrial Average surged more than 12%, one of its best weekly performances on record. Image: CNBC
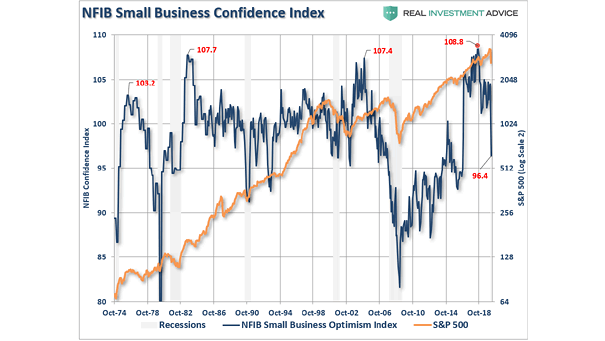
NFIB Small Business Optimism Index Plummets This chart highlights the abrupt turn in small business optimism under coronavirus. Image: Real Investment Advice
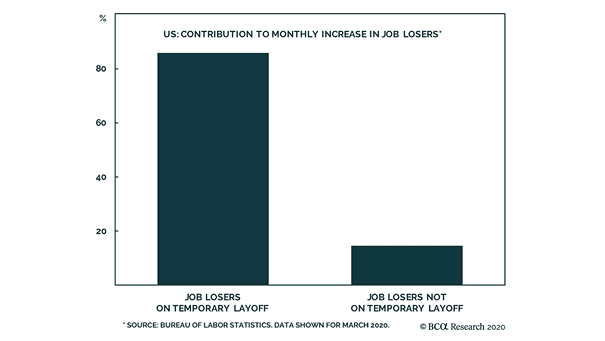
U.S. – Contribution to Monthly Increase in Job Losers As the chart shows, more than 80% of job losers are due to temporary layoffs. Image: BCA Research
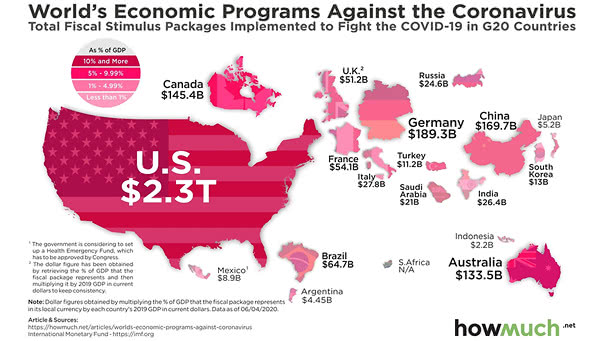
World’s Economic Programs Against the Coronavirus The massive stimulus package should keep the U.S. economic engine running. Image: howmuch.net
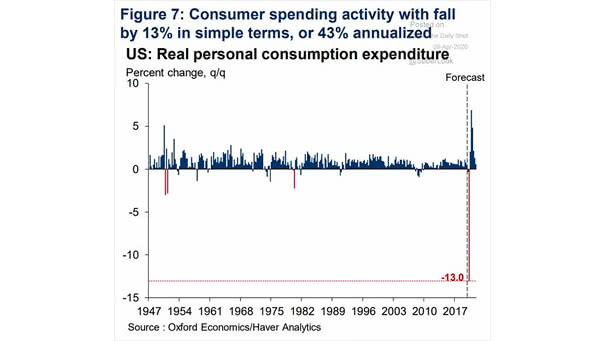
U.S. Real Personal Consumption Expenditure This chart suggests that U.S. consumer spending activity is expected to decline by 13% in simple terms. Image: Oxford Economics
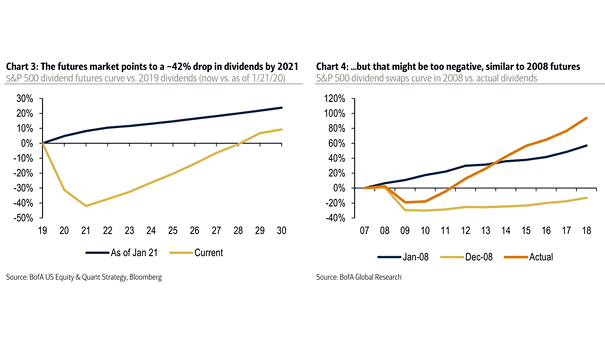
S&P 500 Dividend Futures Curve vs. 2019 Dividends The dividend futures market may be too negative, as it was the case in 2008. Image: BofA US Equity & Quant Strategy
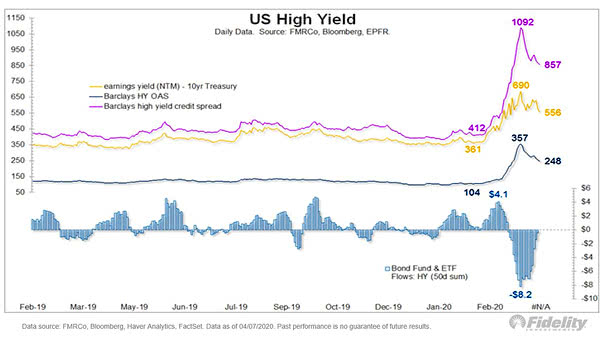
U.S. High Yield High yield credit spreads are currently moving in the right direction. Image: Fidelity Investments