Number of U.S. Corporate Insiders Buying Stock by Month
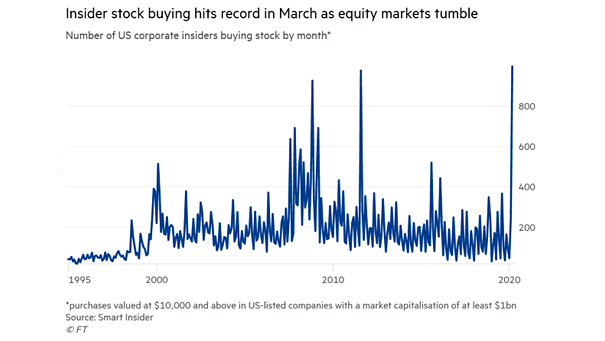
Number of U.S. Corporate Insiders Buying Stock by Month Insiders are confident in an economic recovery and bought the dip in March. Image: Financial Times
Number of U.S. Corporate Insiders Buying Stock by Month Insiders are confident in an economic recovery and bought the dip in March. Image: Financial Times
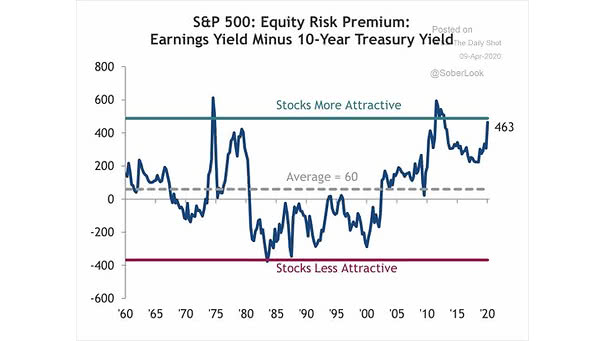
S&P 500 – Equity Risk Premium This chart suggests that the S&P 500 looks attractive relative to bonds. Image: Truist
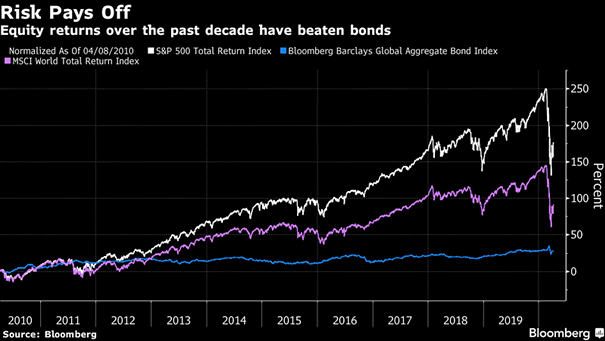
Equity Returns Over the Past Decade Goldman Sachs Private Wealth Management is advising its wealthy clients to get back into equities and favor U.S. stocks (for informational purpose only, not a recommendation). Image: Bloomberg
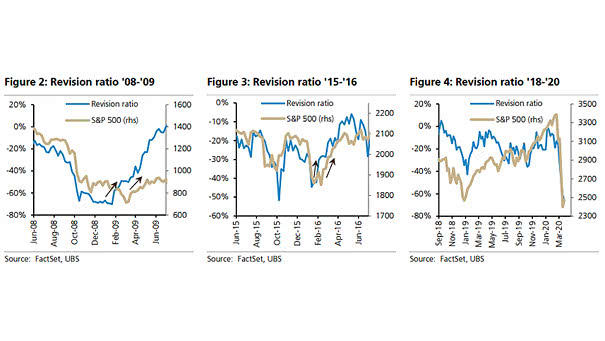
S&P 500 and Earnings Revisions In recent history, the S&P 500 has bottomed when the second derivative of earnings revisions have bottomed. Image: UBS
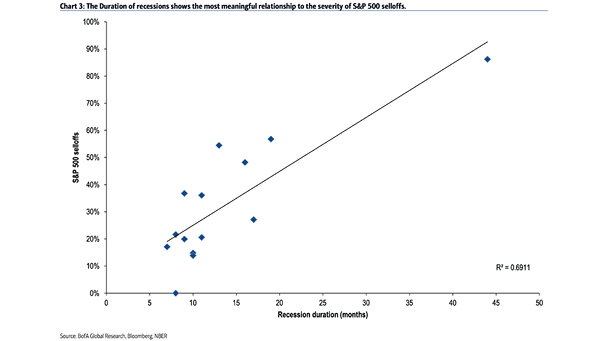
S&P 500 Selloffs and Recession Duration This chart shows the correlation between the duration of recessions and the severity of S&P 500 selloffs (R² = 0.69). Image: BofA Global Research
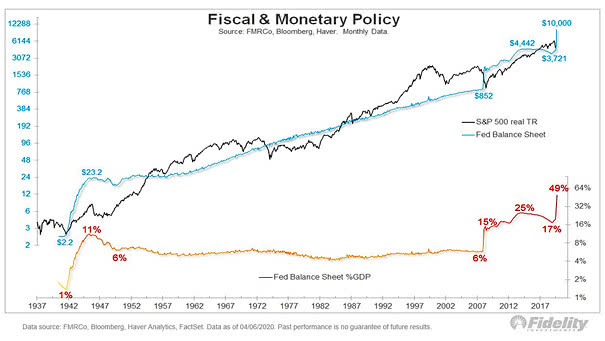
S&P 500 Real Total Return and Federal Reserve Balance Sheet As this chart illustrates, the Fed balance sheet could grow to $10 trillion, equivalent to 49% of U.S. GDP. Image: Fidelity Investments
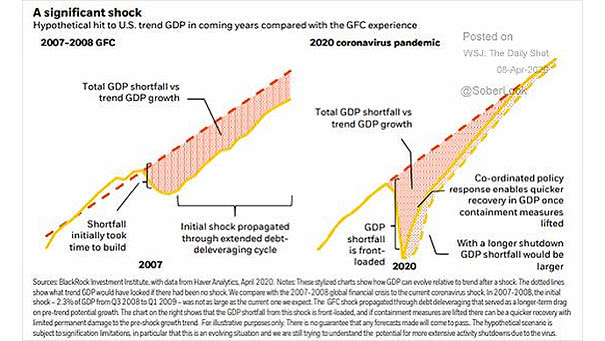
U.S. Trend GDP – 2007-2008 GFC vs. 2020 Coronavirus Pandemic This chart puts into perspective the hypothetical hit to U.S. trend GDP in coming years vs. the global financial crisis. Image: BlackRock Investment Institute
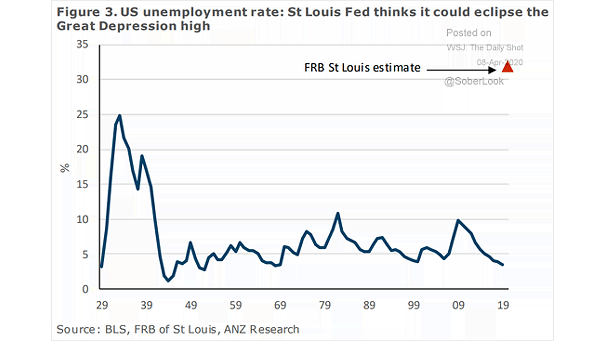
U.S. Unemployment Rate – FRB St Louis Estimate According to St Louis Fed, the US employment rate could eclipse the Great Depression high. Image: ANZ Research
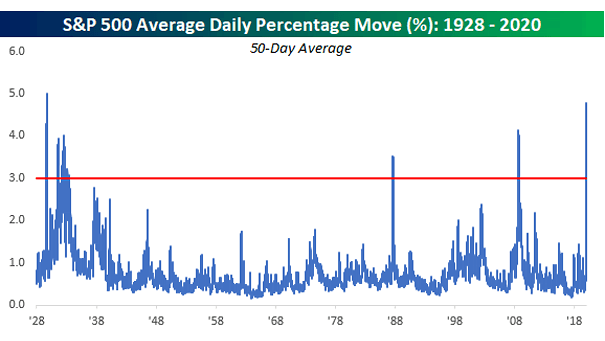
S&P 500 Average Daily Percentage Move: 1928-2020 The volatility has been unusual over the last five weeks, as the S&P 500’s average absolute daily percentage change has been +/-4.8%. Image: Bespoke Investment Group
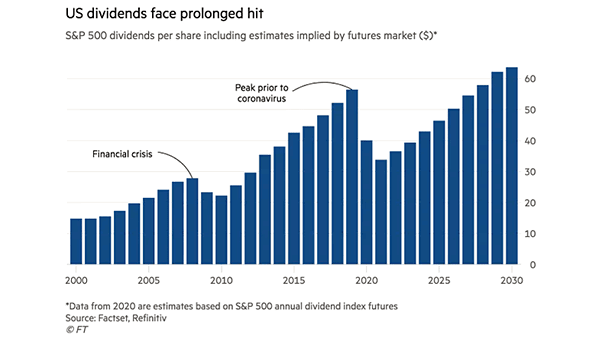
S&P 500 Dividends per Share Including Estimates Implied by Futures Market This chart suggests that dividends will take nine years to recover from the downturn caused by coronavirus. Image: Financial Times
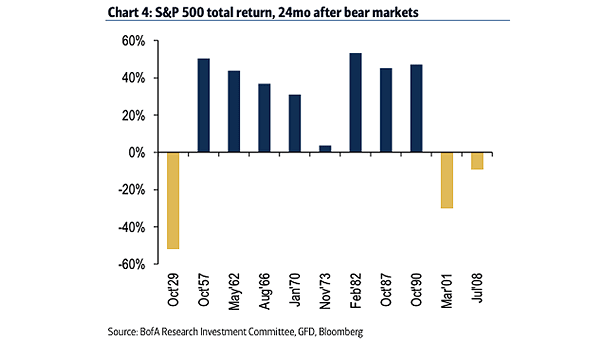
S&P 500 Total Return, 24 Months After Bear Markets This chart puts into perspective the S&P 500 Total Return, 24 months after bear markets. Image: BofA Research Investment Committee