Expected Duration of Global Recession
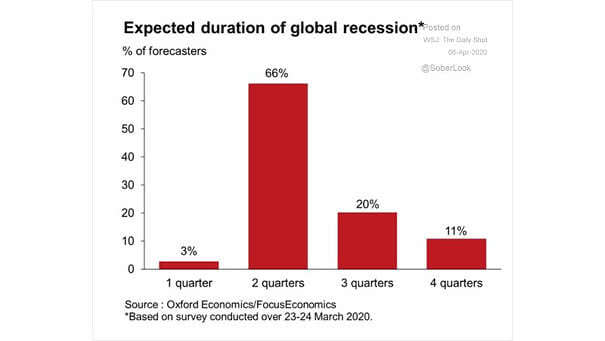
Expected Duration of Global Recession This chart suggests the expected duration of the global recession based on survey data. Image: Oxford Economics
Expected Duration of Global Recession This chart suggests the expected duration of the global recession based on survey data. Image: Oxford Economics
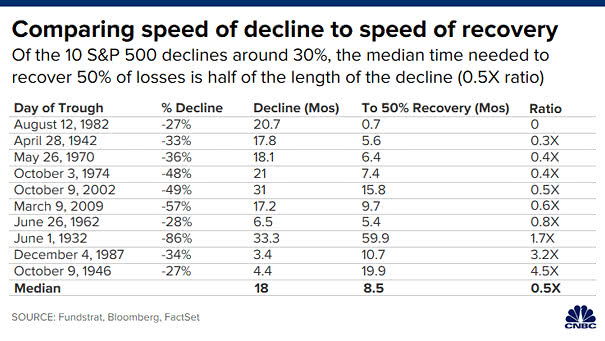
Bear Market – Comparing Speed of Decline to Speed of Recovery Of the 10 stock market drawdowns of about 30% since 1920, the median time needed to recover half of losses, was half the duration…
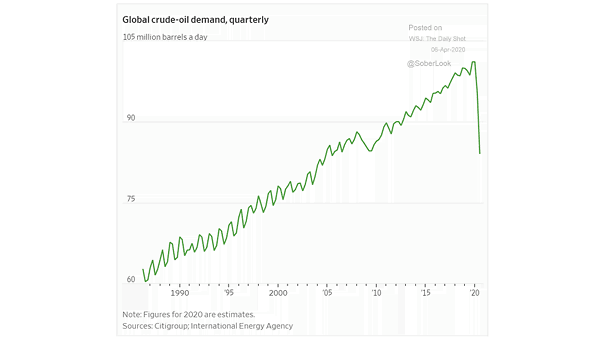
Global Crude Oil Demand Global demand for crude oil has fallen off a cliff, as the coronavirus pandemic spreads in the U.S. and around the world. Image: The Wall Street Journal
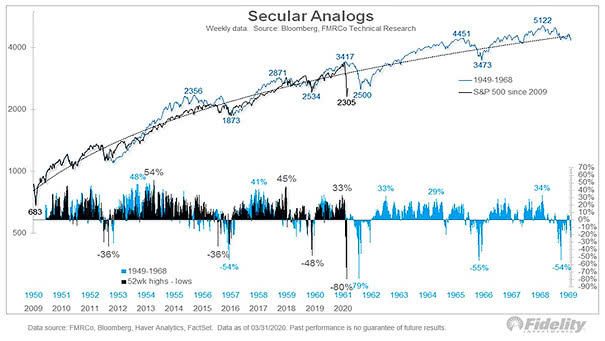
Secular Bull Market Analogs – 1949-1968 vs. S&P 500 since 2009 This chart compares the secular bull market of 1949-1968 vs. the S&P 500 since 2009. In 1962, the breadth thrust was about the same…
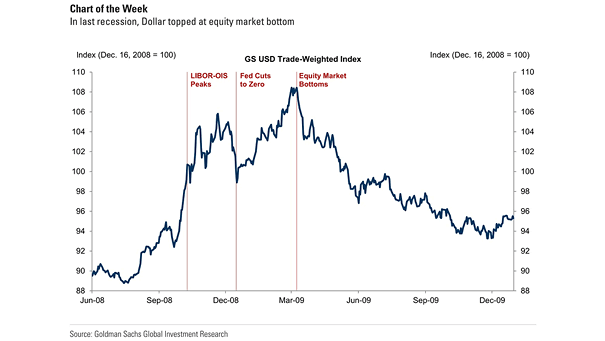
U.S. Dollar and Equity Market Bottom In the last recession, the U.S. dollar topped at the equity market bottom. Image: Goldman Sachs Global Investment Research
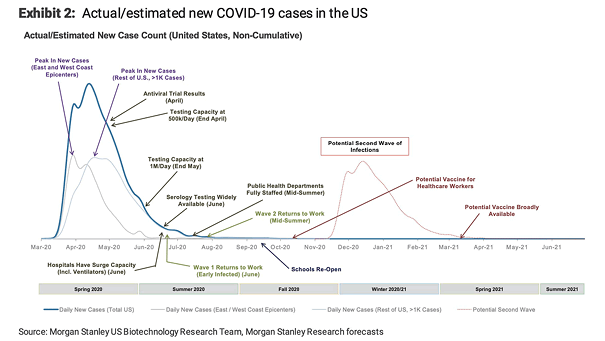
Actual and Estimated New Coronavirus Cases in the U.S. This chart suggests a potential second wave of infections in the United States in the fall of 2020. Image: Morgan Stanley Research
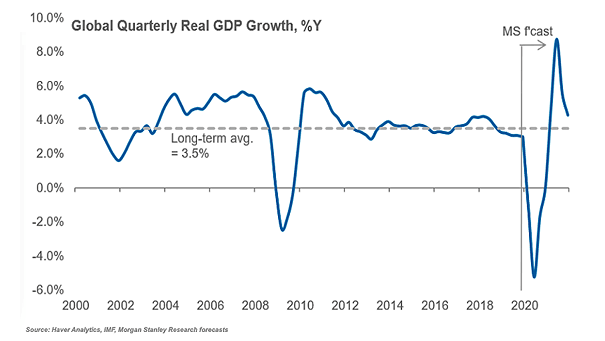
Global Quarterly Real GDP Growth Morgan Stanley forecasts global quarterly real GDP growth at -5.2% in Q2 2020. Image: Morgan Stanley Reasearch
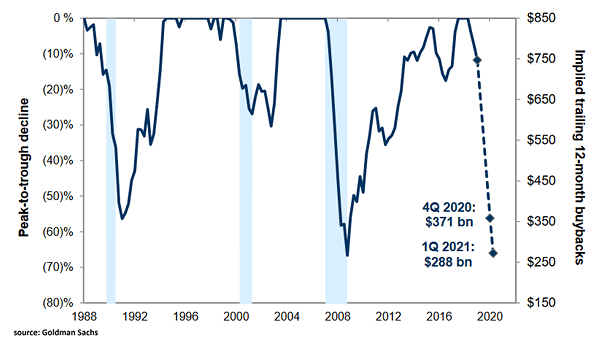
Implied Trailing 12-Month Buybacks Goldman Sachs expects a sharp decline in buybacks in 2020 and 2021, suggesting less support for stock prices and slower EPS growth. Image: Goldman Sachs Global Investment Research
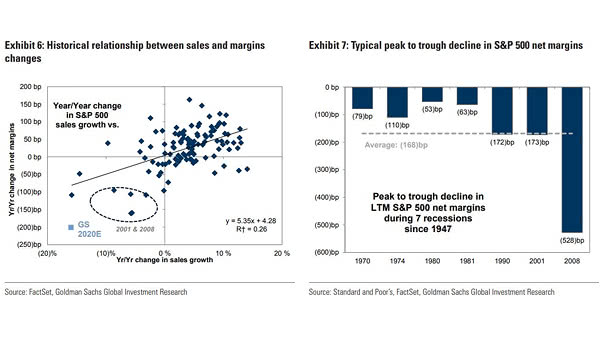
Typical Peak to Trough Decline in S&P 500 Net Margins The peak to trough decline in S&P 500 net margins is 168 bp on average during past recessions. Goldman Sachs expects a contraction in net…
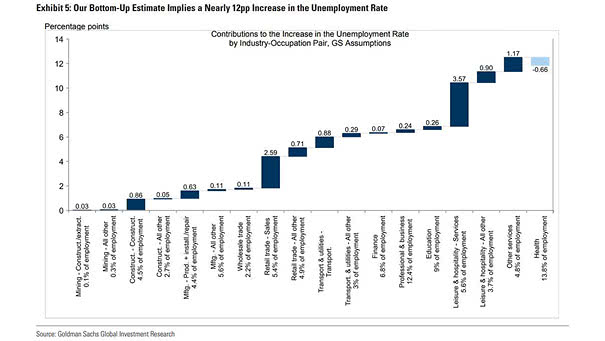
Contributions to the Increase in the Unemployment Rate by Industry-Occupation Pair Goldman Sachs expects a nearly 12% increase in the U.S. unemployment rate. Image: Goldman Sachs Global Investment Research
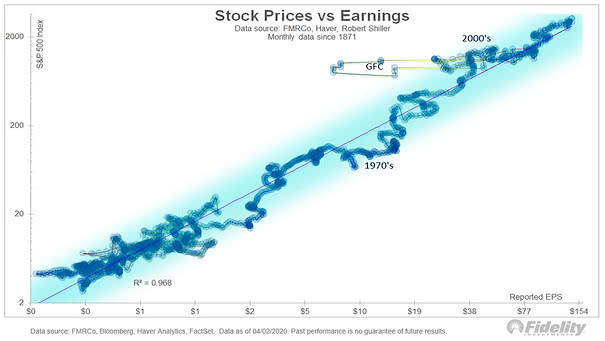
S&P 500 Index vs. Reported EPS This chart shows the very high correlation between stock prices and earnings since 1871 (R² = 0.97) Image: Fidelity Investments