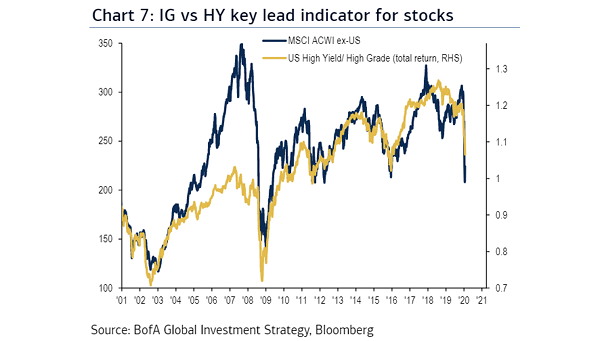
S&P 500 Drawdown and 12-Month Forward P/E

S&P 500 Drawdown and 12-Month Forward P/E The current market selloff is in line with the average S&P 500 drawdown and 12-month forward P/E, since 1987. Image: Goldman Sachs Global Investment Research

Market Breadth (S&P 500)

Market Breadth (S&P 500) New 52-week highs minus new 52-week lows is the third lowest in history after 2008 and the 1930s. Image: Fidelity Investments

Cumulative Bond Flows Since 2009

Cumulative Bond Flows Since 2009 Flows into high-yield funds had been out of favor in this cycle. Is this good news? Image: Deutsche Bank Asset Allocation

U.S. Equity Mutual Funds Flow

U.S. Equity Mutual Funds Flow U.S. equity mutual funds have experienced the biggest drop in asset under management since 2008. Image: Macrobond Financial

S&P 500 30% Pullbacks

S&P 500 30% Pullbacks It took only 22 trading days for the S&P 500 to fall 30% from its record high. Image: CNBC

Gold, U.S. Trade Weighted Dollar and S&P 500

Gold, U.S. Trade Weighted Dollar and S&P 500 In 2008, gold outperperformed after the Fed stepped in and removed liquidity constraints. Image: Goldman Sachs Global Investment Research