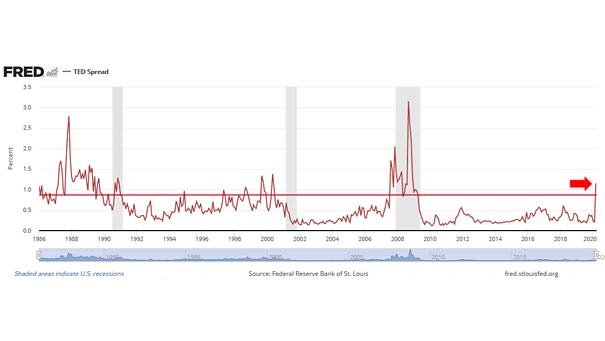
U.S. TED Spread
U.S. TED Spread The TED spread (spread between 3-month LIBOR and 3-month Treasury bill) shows that financial conditions are tightening at the fastest pace since the 2008 crisis.
U.S. TED Spread The TED spread (spread between 3-month LIBOR and 3-month Treasury bill) shows that financial conditions are tightening at the fastest pace since the 2008 crisis.
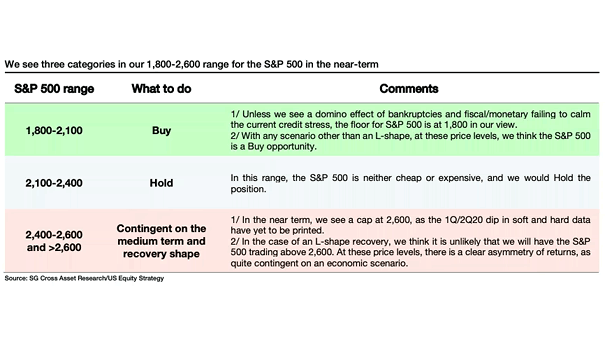
S&P 500 Range in the Near-Term This table suggests a 1,800-2,600 range for the S&P 500 in the near-term. Image: Societe Generale Cross Asset Research
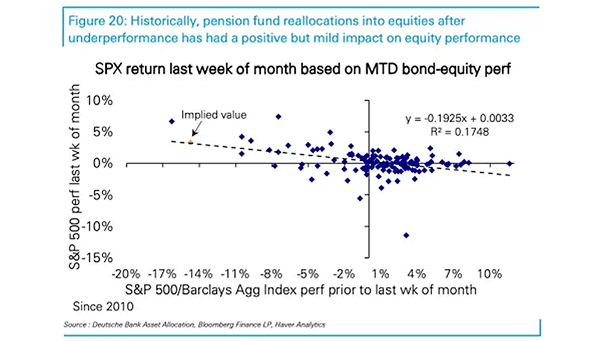
S&P 500 Return Last of Month Based on MTD Bond-Equity Performance Historically, pension fund rebalancing into equities has had a mild impact on performance. Image: Deutsche Bank Asset Allocation
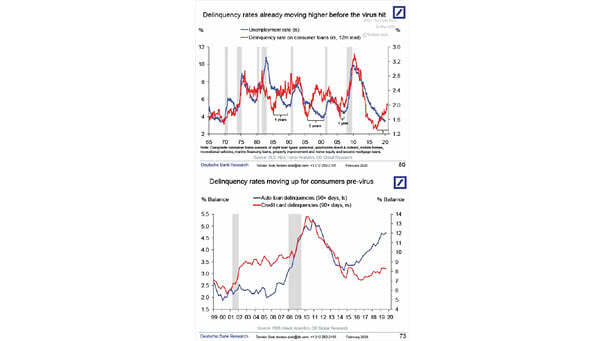
U.S. Delinquency Rate and Unemployment Rate Hopes of a V-shaped recovery are fading, as delinquency rates were already moving higher before the virus hit. Image: Deutsche Bank Global Research
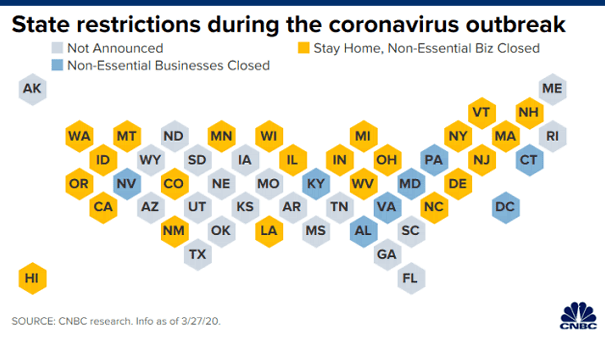
U.S. States Restrictions during the Coronavirus Outbreak Twenty-three states have closed non-essential businesses and have issued stay-at-home orders. Image: CNBC
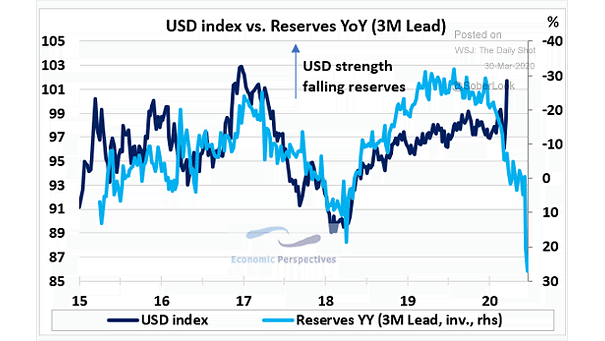
U.S. Dollar Index vs. Reserves (Leading Indicator) This chart suggests that reserves tend to lead the U.S. dollar index by three months. Lower U.S. dollar ahead? Image: Economic Perspectives
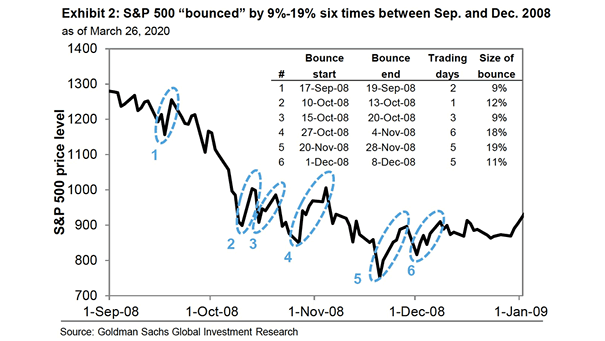
Bear Market Rally – S&P 500 “Bounced” in 2008 To put the current bear market rally in perspective, this chart shows that the S&P 500 “bounced” six times by 9% to 19% in 2008. Image:…
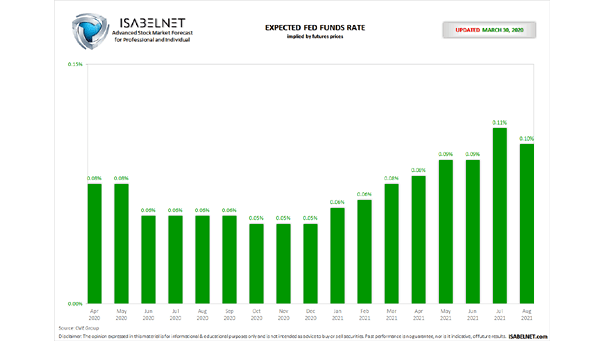
Expected Fed Funds Rate Fed funds futures for January 2021 imply an expected rate of 1.18%. Click the Image to Enlarge
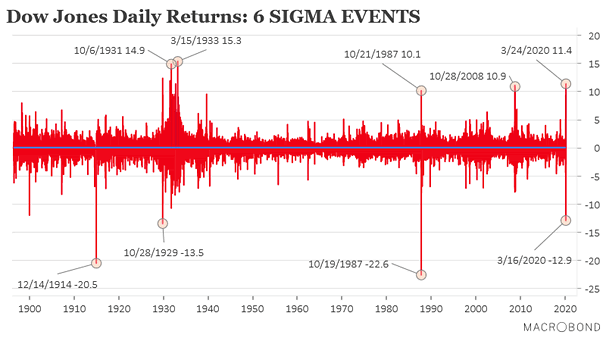
Dow Jones Daily Returns and 6 Sigma Events As the chart shows, an event of 6 standard deviations above or below the mean, is extremely rare. Image: Macrobond Financial
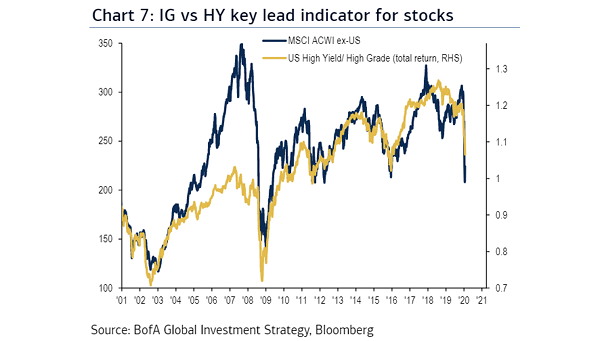
U.S. High-Yield vs. Investment-Grade and MSCI ACWI ex-US (Leading Indicator) This chart suggests that the ratio of high-yield to investment-grade bond performance is a leading indicator for stocks. Image: BofA Global Investment Strategy
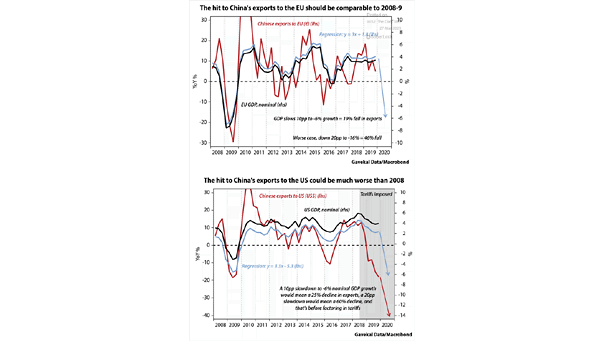
Chinese Exports to EU and U.S. The impact on Chinese exports to the U.S. could be much worse than 2008. Image: Gavekal, Macrobond