Nasdaq 100 Index and 200-Day Moving Average
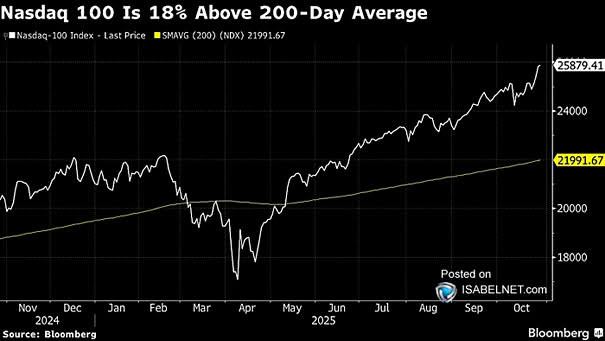
Nasdaq 100 Index and 200-Day Moving Average The Nasdaq 100 keeps ripping higher, but its widening gap from the 200-day average is starting to blink red for a possible 5%–10% pullback. Image: Bloomberg
Nasdaq 100 Index and 200-Day Moving Average The Nasdaq 100 keeps ripping higher, but its widening gap from the 200-day average is starting to blink red for a possible 5%–10% pullback. Image: Bloomberg
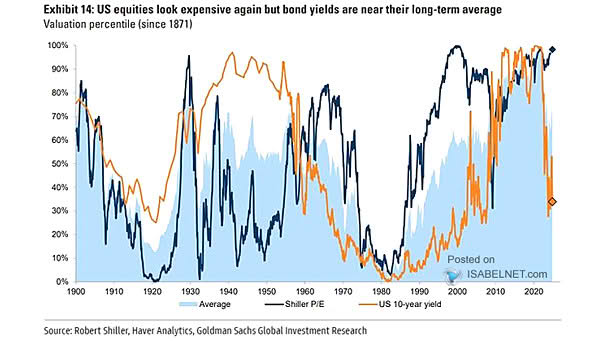
Valuation – Shiller P/E and U.S. 10-Year Yield Sure, U.S. equities are expensive, but inflation and debt worries make bonds no easy refuge either. The smart move now? Stay selective, not scared. Image: Goldman Sachs…
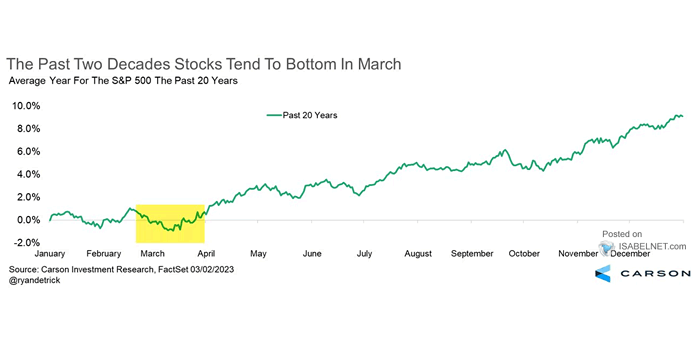
Returns – Average Year for the S&P 500 October 27 has a curious pull on markets — a date when U.S. stocks often find a floor before seasonal inflows spark a late‑year surge. Image: Carson…
Median Global Real Return in USD by Asset Class While the 60/40 portfolio can’t match stocks in full bull mode, its long-run performance comes surprisingly close — a reminder that bonds still ground both risk…
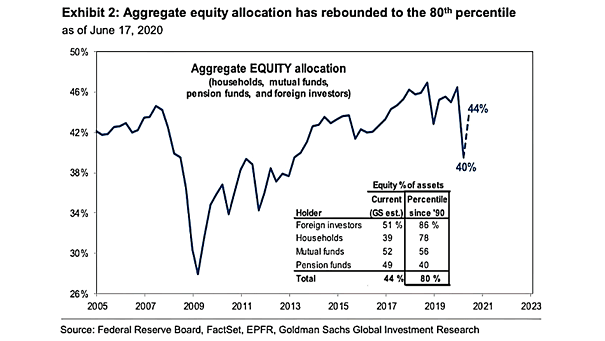
Equity Allocation as % of Household Financial Assets Equities dominate household portfolios in the U.S., Australia, and Sweden, but caution still rules in Europe and Japan, where cash and liquid assets remain king. Image: Goldman…
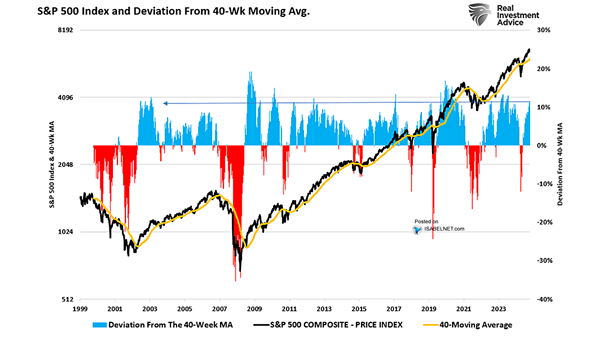
S&P 500 Index and Deviation from 40-Week Moving Average The further the S&P 500 drifts from its 40-week moving average, the harder the reversion’s likely to be. It’s not a bear market call — just…
S&P 500 Index – Seasonal 3-Month Forward Return Historically, this is go-time for the S&P 500. If past trends hold, the next three months could deliver some of the index’s strongest cumulative gains. Image: Renaissance…
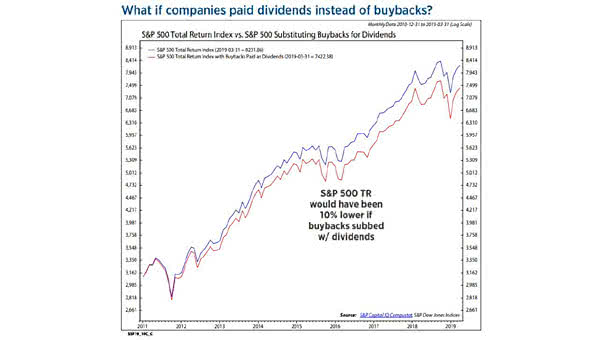
Buyback Aristocrats vs. Dividend Aristocrats Fueled by growth momentum and turbo‑charged buybacks, Buyback Aristocrats have left Dividend Aristocrats in the dust, as investors chase upside over income stability. Image: Goldman Sachs Global Investment Research
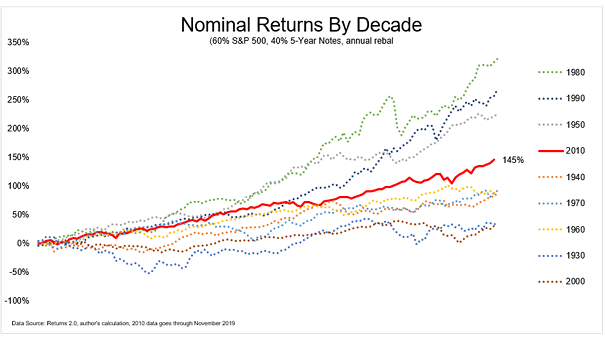
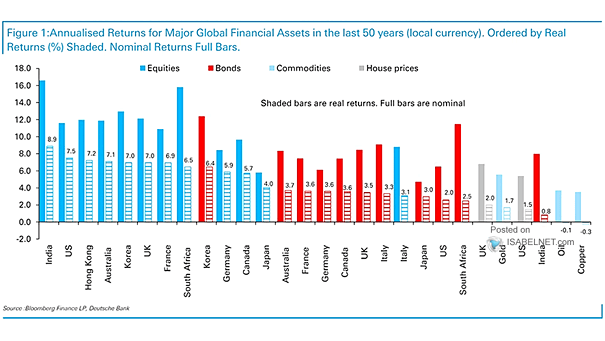
Returns – Global Equities vs. Global Bonds vs. Gold vs. World Portfolio Since 1950, the world portfolio has earned a real 4.1% annual return — global equities led with 7.3%, gold lagged at 2.5%, and…
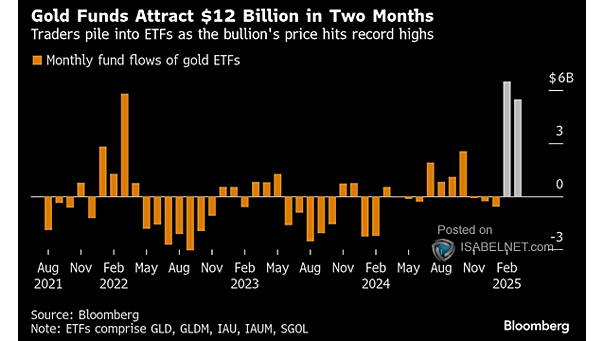
Total Known Gold ETFs Holdings Gold’s shine isn’t fading. ETF holdings just hit a three‑year high, and even with this week’s selloff, gold prices are still up over 50% this year. Image: Bloomberg
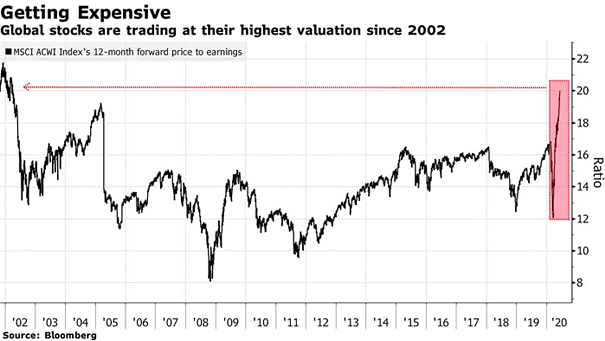
MSCI ACWI Index and Best Earnings-Per-Share With stocks priced for perfection and earnings forecasts at record highs, even a mild miss could put the market’s rally on the ropes. Image: Bloomberg