S&P 500 Index Performance When Lower First Two Months
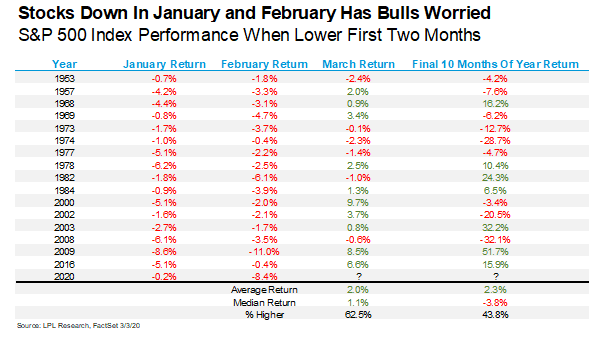
S&P 500 Index Performance When Lower First Two Months Historically, when the S&P 500 index was down in January and February, the entire year was down almost 5% on average. Image: LPL Research
S&P 500 Index Performance When Lower First Two Months Historically, when the S&P 500 index was down in January and February, the entire year was down almost 5% on average. Image: LPL Research
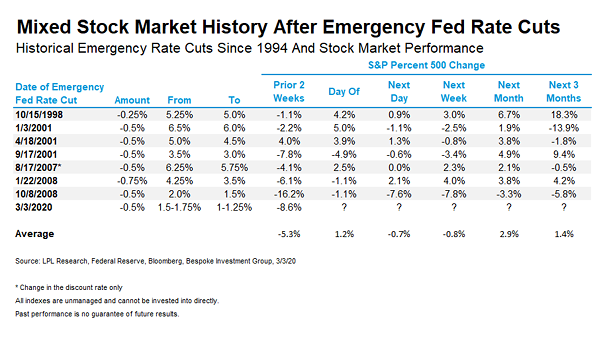
Historical Emergency Rate Cuts since 1994 and Stock Market Performance After emergency rate cuts, the table shows that the performance of the S&P 500 has been mixed. Image: LPL Research
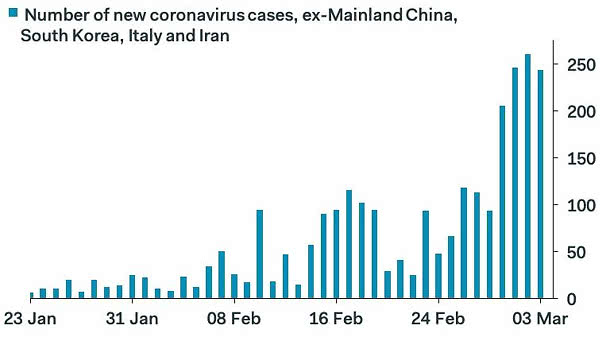
Number of New Coronavirus Cases, Ex-Mainland China, South Korea, Italy and Iran Chart suggesting that the growth of new coronavirus cases, ex-Mainland China, South Korea, Italy and Iran aren’t accelerating. Image: Pantheon Macro
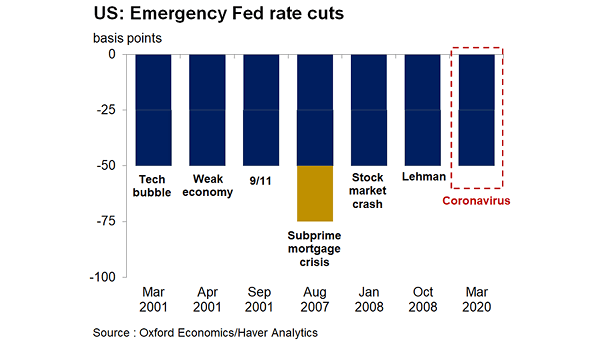
U.S. Emergency Fed Rate Cuts This charts puts the Fed’s emergency rate cut into perspective. Image: Oxford Economics
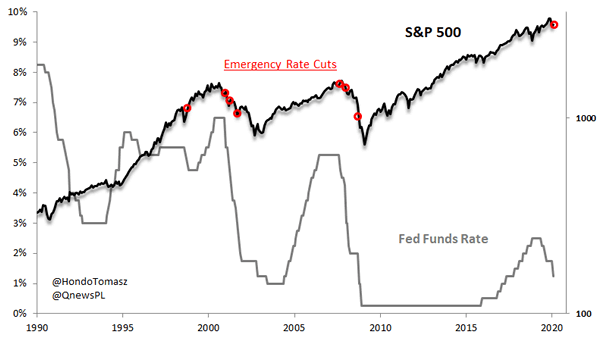
S&P 500 and Emergency Rate Cuts In recent history, emergency rate cuts occurred during or just prior to the decline of the stock market. Image: Hondo Tomasz
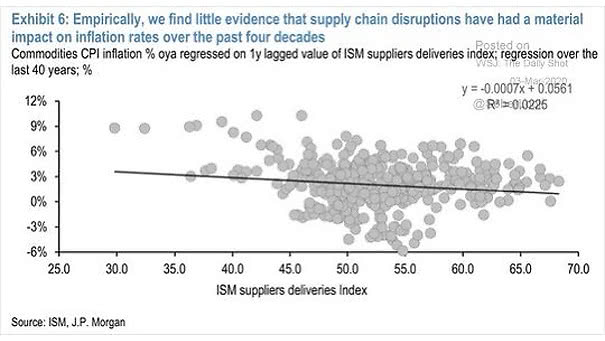
Inflation and Supply Chain Disruptions Chart suggesting that supply chain disruptions have no material impact on inflation. Image: J.P. Morgan
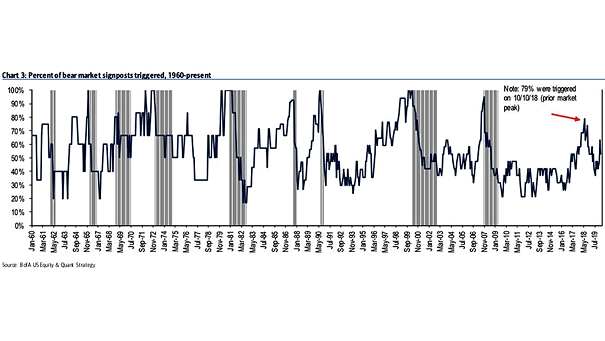
Percent of BofA Bear Market Signposts Triggered 79% of BofA bear market signposts were triggered on October 10, 2018 vs. 53% currently. Image: BofA US Equity & US Quant Strategy
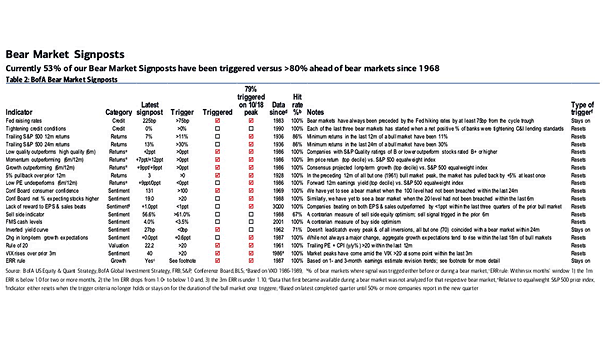
BofA Bear Market Signposts Currently, 10 bear market signposts have been triggered vs. 15 on 10/18 market peak. Image: BofA US Equity & Quant Strategy Click the Image to Enlarge
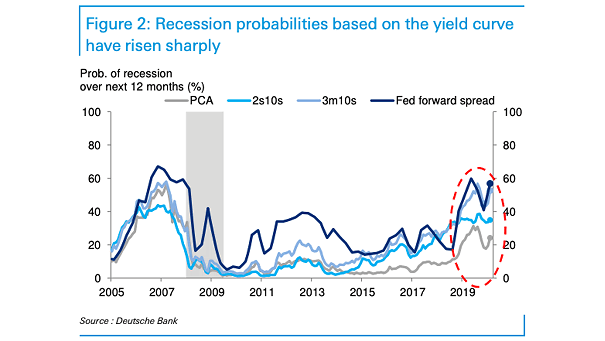
U.S. Recession Probabilities Based on the Yield Curve The probability of a U.S. recession over the next 12 months, based on the yield curves, has risen significantly. Image: Deutsche Bank
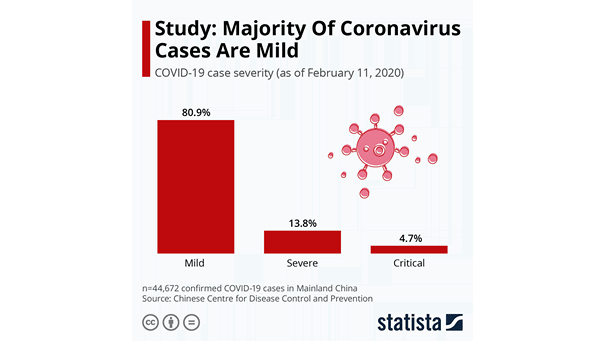
Coronavirus Case Severity Over 80% of coronavirus cases are mild. This could explain why it is spreading so rapidly. Image: Statista
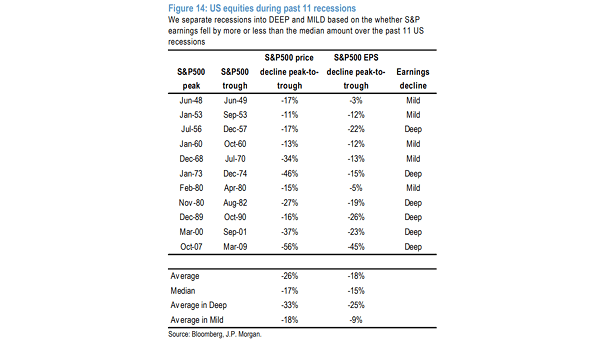
U.S. Equities During Past 11 Recessions The S&P 500 has declined by 15% from its peak. The average decline over the past 11 recessions is 26%. U.S. equity markets price in 15/26 = 57% chance…