S&P 500 – Secular Bull Market Analogs
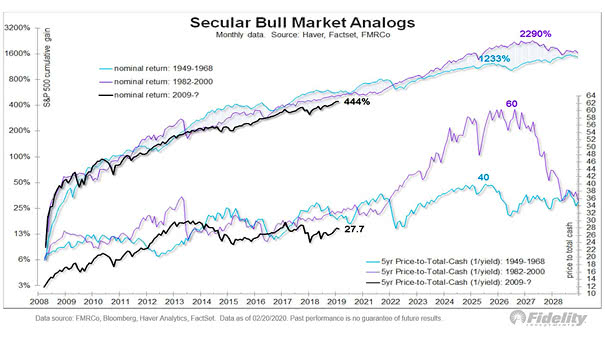
S&P 500 – Secular Bull Market Analogs The bull market that began in 2009 could have similarities with the secular bull markets of 1982-2000 and 1949-1968. Since the Great Recession, US stocks have behaved like…
S&P 500 – Secular Bull Market Analogs The bull market that began in 2009 could have similarities with the secular bull markets of 1982-2000 and 1949-1968. Since the Great Recession, US stocks have behaved like…
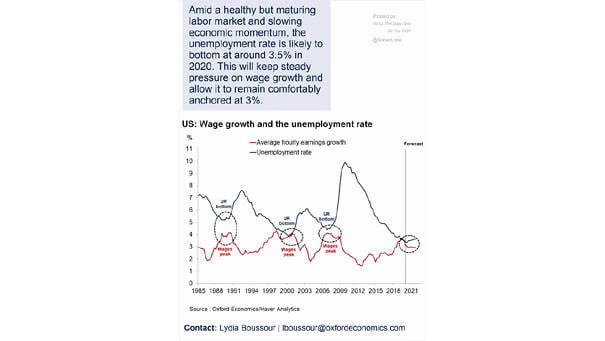
U.S. Wage Growth and U.S. Unemployment Rate Has U.S. wage growth peaked? This chart suggests that the U.S. unemployment rate could bottom out at around 3.5% this year. Image: Oxford Economics
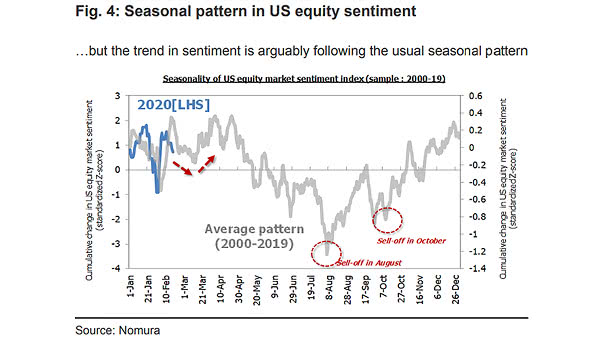
Seasonality of U.S. Equity Market Sentiment Index This chart puts into perspective the seasonal pattern in U.S. equity sentiment. Image: Nomura
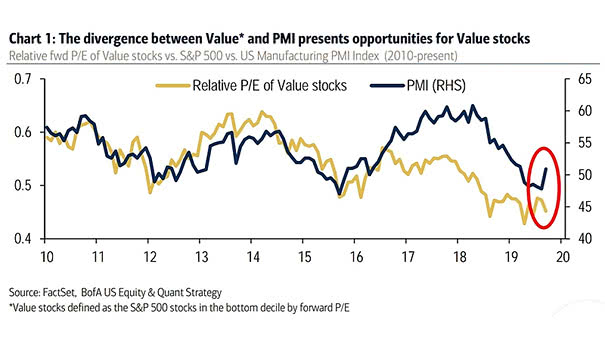
Relative P/E of Value Stocks vs. S&P 500 vs. U.S. Manufacturing PMI Index BofA remains bullish on value stocks in the coming months, due to improving macro conditions. Image: BofA U.S. Equity and Quant Strategy
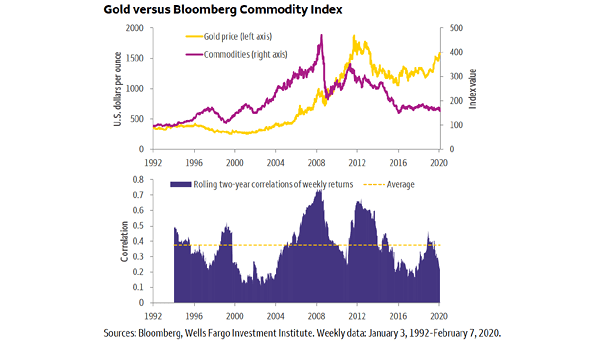
Gold Prices vs. Commodities The declining correlation between the price of gold and commodities may suggest that the commodity bear super-cycle is nearing its end. Image: Wells Fargo Investment Institute
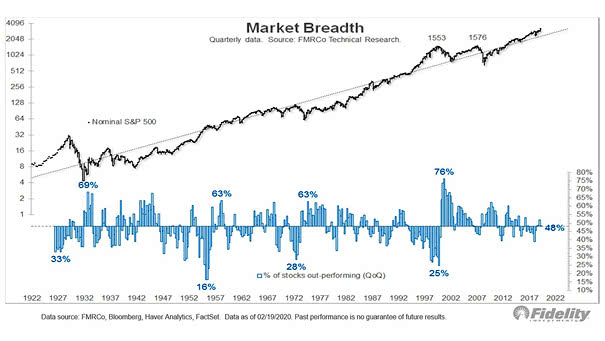
U.S. Market Breadth At the dotcom bubble peak, the percentage of stocks outperforming the S&P 500 was 27% vs. 42% today (the historical average is 48%). Currently, the relative market breadth isn’t as extreme as…
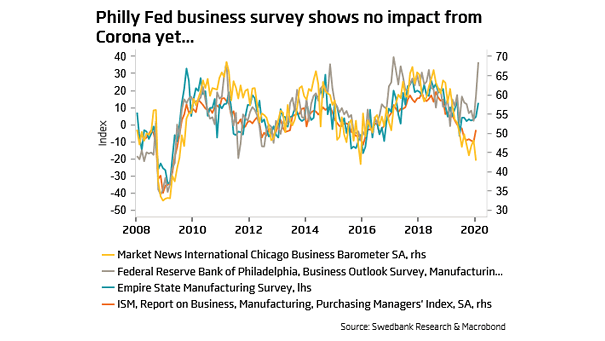
Philly Fed Manufacturing Index and Empire State Manufacturing Survey and ISM Manufacturing Index Despite the coronavirus, both regional PMIs suggest an increase in U.S. ISM manufacturing this month. Image: Swedbank Research
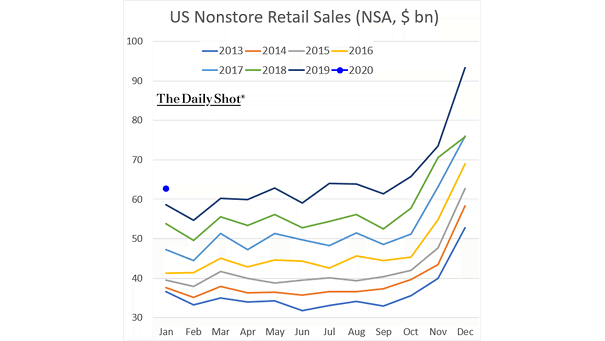
U.S. Nonstore Retail Sales This chart puts into perspective U.S. nonstore retail sales, which are a proxy measure for ecommerce performance. Image: The Daily Shot
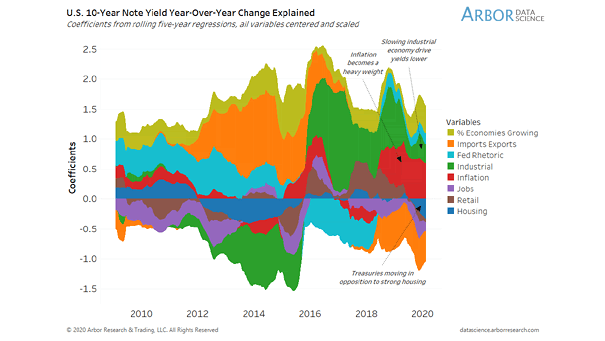
U.S. 10-Year Treasury Note Yield Year-Over-Year Change Explained Chart suggesting that the slowing industrial economy and inflation explain U.S. 10-year Treasury note yield. Image: Arbor Research & Trading LLC
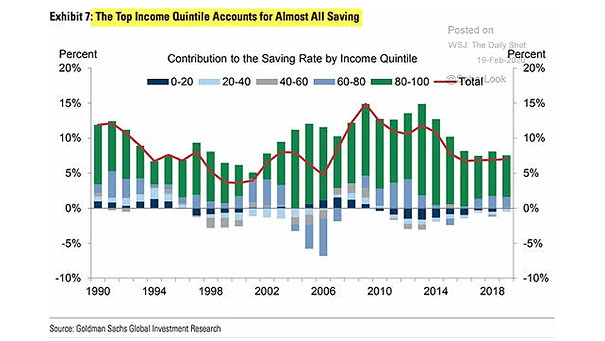
Inequality – Contribution to the Saving Rate by Income Quintile in the U.S. The top 20% of households account for almost all the savings in the United States. Image: Goldman Sachs Global Investment Research
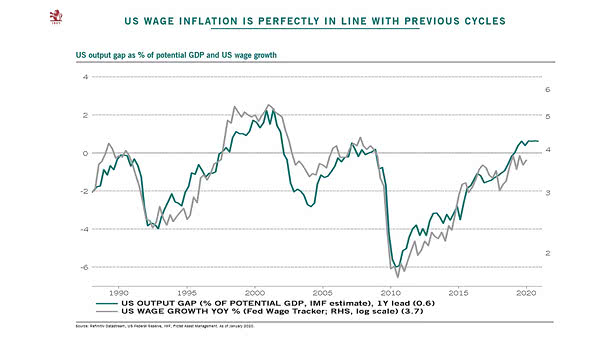
U.S. Output Gap as % of Potential GDP and U.S. Wage Growth (Leading Indicator) Chart suggesting that US output gap as % of potential GDP tends to lead US wage growth by one year. Image:…